
Richard Krivo of DailyFX.com explains how Forex traders can use different time charts to find money–making trades.
As price on a currency pair continually changes, we track that movement by looking at charts. Remember that a currency pair is moving through all time frames simultaneously.
As we consult different time frame charts on the pair, we get a different “look” on each time frame as to how the pair has been moving. This “multiple view” benefits us as a trader when we combine several time frames to optimize the entry, by making certain all of our time frames are aligned prior to our entry.
Let’s say for example, that we use the daily, four–hour and hourly time frames for our analysis. It is beneficial for us to wait to enter the trade until the smaller time frames are in agreement with the largest time frame we are using. We use the largest time frame since it contains the greatest amount of data, and as such provides the most reliable feedback.
The whole process regarding trading in general and Multiple Timeframe Analysis (MTFA) in particular begins by identifying the trend…the direction in which the market has been moving the pair over time. For our purposes here, the trend can be identified on the daily chart.
Taking a look below at the historical daily chart of the EUR/USD, which goes back to February, we can see that the pair has broken through trend line support and has been posting lower highs and lower lows. Also, Slow Stochastics is below 20, with the faster K line below the slower D line…both of those are bearish signs. Based on this, we know that we only want to sell the pair.
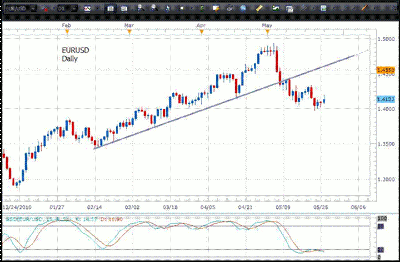
Click to Enlarge
So now that we know the direction we want to trade the pair, we go down to a lower time frame to “fine tune” the entry. The four–hour chart on the EUR/USD below shows how the pair moved to the upside (retraced) and now is poised, potentially, to move back to the downside in the direction of the trend we identified on the daily chart.
Using Slow Stochastics to identify when downside (bearish) momentum takes hold, we would enter when both the K and the D line of Slow Stochastics cross below 80.
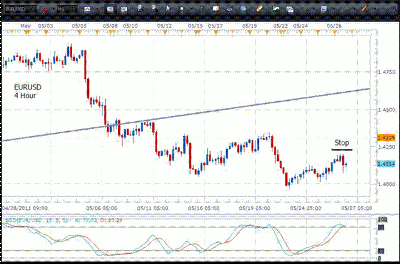
Click to Enlarge
Since the four–hour chart is providing what I consider an optimum entry signal, I would not refine the entry further by consulting the hourly chart. (If the four–hour chart was giving mixed messages, however, I would drill down to the hourly to see if the entry could be further optimized.)
In a nutshell, to implement MTFA in our trading, after we establish the trend, we want to check several lower time frame charts and not enter the trade until they are in agreement with the longer–term chart that we used to establish the trend. Once the time frames are in agreement, it is like aligning the tumblers in a lock so the lock may open freely.
Below is a visual that may assist in understanding the concept:
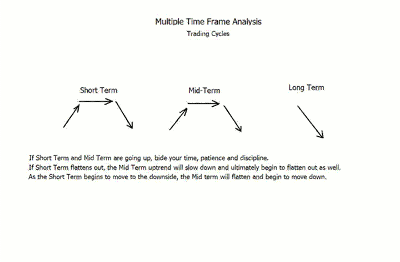
Click to Enlarge
Richard Krivo is a currency analyst with DailyFX.com.


