Walker England of DailyFX.com explains how Forex traders can use an indicator developed by Welles Wilder to find reversal points.
Trend traders love to find longstanding market momentum and trends that can last days, months, or even years. However, once the trend is found, traders often find difficulty when planning to enter and manage a position.
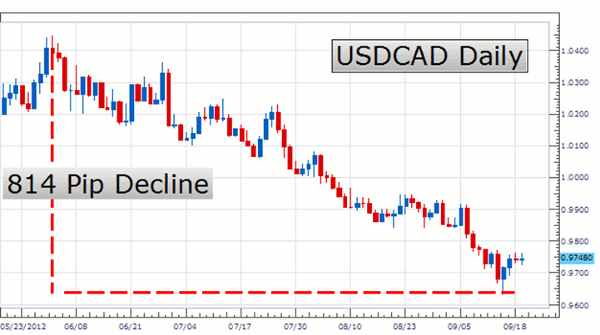
Below, we can see an example of a strong trend on the USD/CAD daily chart. It has moved as much as 814 pips lower over the course of the last three trading months. So where could a trader potentially enter into the market, and more importantly, how could we manage our risk?
Today we are going to look at an indicator that can help with both market entries and placing stops in trending markets. So let’s get started learning about using the PSAR (Parabolic Stop and Reverse).
How to Read PSAR
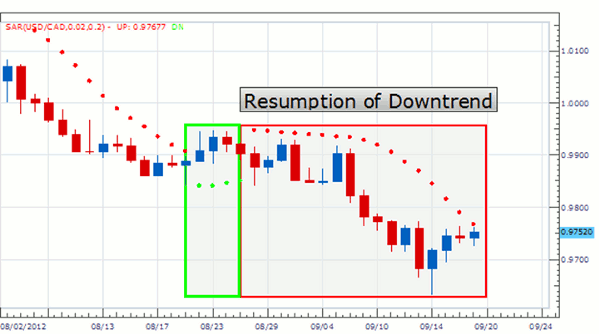
PSAR is a technical indicator that was invented by Welles Wilder with the goal of finding points of reversals in trending markets. If price is below a red PSAR dot as pictured below, this will be indicative of a continued downtrend as lower lows are created. When price is moving higher, the opposite is true. PSAR will be below price and be colored green to indicate return higher prices.
In keeping with the trend analysis from our daily chart, traders should look for new red PSAR dots to pinpoint the resumption of the trend. The red box in the picture below will show us an example of the resumption of our downtrend on the USD/CAD. PSAR denotes this point when price intersects and moves below our previous green PSAR dot.
This resumption of the downtrend is easily seen by the creation of a new red PSAR dot on our chart. This offers sellers a chance to place new market entries to join the daily trend. If we look carefully, we can see price quickly approaching our current red PSAR dot. As price pulls back against the standing trend, let’s learn how to manage potential stop orders using the PSAR indicator.
Managing Positions
Traders can use PSAR to manage their positions in the fashion of a trailing stop. During strong trends, price will head in one direction for a long period of time.
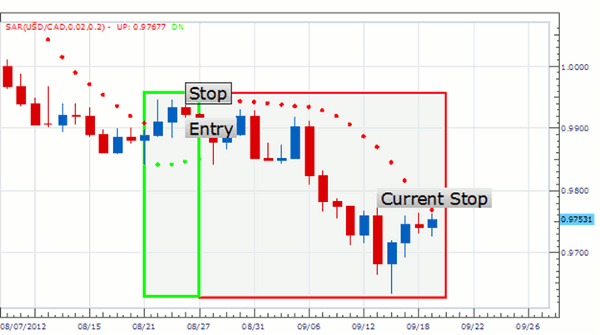
As pictured below, we can see the USD/CAD trading in a downtrend with price remaining under our red PSAR dot as long as it continues. To take advantage of this, our stops can be moved forward to the position of the current PSAR dot.
In the chart below, our initial stop would have been placed at .9948. This will trail our stop forward approximately 181 pips to our current PSAR level of .9767. Each day as a new SAR dot is created, we can continue this process of updating our stops and locking in profit as our trend continues.
Walker England is a currency trading instructor at DailyFX.com.


