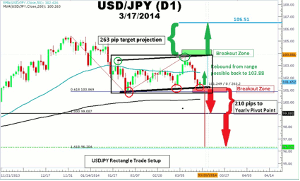
Since the 300-pip drop from the January highs above 105.30, this pair has been locked in a rectangle pattern, and Gregory McLeod of DailyFX.com offers three ways to trade it.
Forex currency pairs spend a majority of their time in ranges. These ranges take on a variety of shapes and sizes; diamonds, wedges, triangles and rectangles. These consolidation patterns can stretch out for hours, days, and weeks. “The longer the base, the higher the race,” is a cliché often used by traders to describe these extended consolidations. The forex rectangle is one such pattern that offers traders three ways to trade them; breakout above resistance, breakout below support, and range trading.
USD/JPY Daily Chart Rectangle

Created with Marketscope 2.0
Click to Enlarge
Typically, the rectangle pattern is made up of a clearly defined resistance line formed by connecting at least two swing highs. The top of the rectangle acts as a ceiling for price. The forex rectangle also has support line made up of at least two swing points. By measuring the height of the rectangle and projecting that height above resistance and below support, traders can determine breakout price targets. Notice in the chart above how USD/JPY price action is contained between the boundaries of the rectangle.
The first way that someone can trade this rectangle is by entering long at the 101.19 to 102.00 support zone in order to trade the range. They would place a stop around 100 pips. Range traders would then look to take profits at the 103.88 rectangle top. If USD/JPY reaches the 103.88 resistance zone, range traders may enter short for a move back down to the support zone with a 100-pip stop above the entry.
The second way to trade this a rectangle pattern is by trading the breakout above resistance. Breakout traders will look to enter long when price breaks above the 103.88 resistance zone that formed the top of the rectangle pattern. Bullish breakout traders may look to reduce the amount risked by placing a stop at the midpoint of the rectangle pattern near 102.00 and targeting 106.51.
The third way to trade the USD/JPY rectangle is by waiting for price to close below support in the 101.12 to 101.00 area. A protective stop loss can be placed in the middle of the range around the 102.00 area and targeting the yearly pivot point at 99.08. The yearly pivot is also the 100% Fibonacci extension target of the USD/JPY drop from the 105.42 high to the February lows of 100.76 and retracement to 103.75.
Since USD/JPY entered the rectangle from the top, there is a bias for a bearish breakout. However, price can do what it wishes. If you do choose to trade a breakout above resistance or below support, wait for a closed candle that appears outside the range before entering the trade. In this way, you can reduce the chance of being caught in either a bull trap or a bear trap.
By Gregory McLeod, Trading Instructor, DailyFX.com


