While it is generally believed that this kind of breakout system does not work well anymore, particularly in the forex market, Adam Lemon, of DailyForex.com, highlights how and why he's found—from his own research—that this Turtles-style trading can work well in the forex market.
Some traders prefer to use breakout points to signal their trend entries, others prefer to use indicators which just show strong directional momentum. Who is right and which works better?
The Turtle Traders
In the early 1980s, the famous trader Richard Dennis bet his partner that he could take raw recruits and turn them into very profitable traders by teaching them a fairly simple trading system. To cut a long story short, he was indeed able to recruit some novices, give them a system and capital, and watch them make spectacular profits over a period of a few years. For a long time, there was a lot of speculation about exactly what this superbly profitable trading strategy was. A few years ago, some of the original Turtles published the rules of the strategy that was given to them.
The Turtle Trading System
The heart of the system governing trade entries was to trade a range of instruments, entering long when a price made a 55-day high or short at a 55-day low: Donchian channel breakouts. Stop loss was simply a function of volatility and were calculated by the instrument’s average true range (ATR). It was a trend trading system.
It is generally believed that this kind of breakout system does not work well anymore, particularly in the forex market where forex breakouts very often become fake-outs. However, I have been surprised to find from my own research that Turtles style trading can actually work very well in the forex market, compared to more complex entry systems involving indicators, time of day, etc.
Turtles-Style Trading in Forex
As the Turtles traded a diverse range of markets, you would think that a key part of successfully applying their methods in the forex market would be to trade all currency pairs equally. In fact, research shows that the USD is the key driver of the forex market and that USD currency pairs have a strong propensity to trend. This might well change in the future if the USD lost its role as the primary global currency, but for now it holds true. After the USD, the euro is the next most strongly trending currency. So it is a good idea to only apply this trading strategy to USD currency pairs.
The Turtles used 55-day and occasionally 20-day breakouts. This periods are too short-term for the modern forex market. Since 2008, a 70-day period corresponding to three months has been a great trend indicator and it also worked well before then in the earlier part of the modern forex era.
NEXT PAGE: Getting the Turtle Traders Out of Their Shells
|pagebreak|One final twist can be added to improve performance. The entry prices for each currency pair can be calculated at the close of each day and entry orders set accordingly. The stop loss is also calculated as a function of the average true range. However, if the price is below or falls below the stop loss price before the entry price is triggered, no trade should be taken. This mechanism prevents trades being entered where it is likely that the price will find itself exhausted very soon after the breakout happens.
Strategy Rules
- Enter long when the price breaks the highest price of the last 70 days or short when it breaks the low of the last 70 days, provided the stop loss price is not breached before entry.
- The stop loss may be based upon 0.5, 1, or 2 units of the 20-day average true range.
- A consistent trade size in cash should be used and it should ideally be kept small, at not more than 0.25% of capital per 2 times ATR.
- Trade only the major USD pairs and commodity currencies paired with USD. A fundamental analysis filter may be used to improve trade selection.
- A range of methods may be used to determine trade exits.
Back Test Results
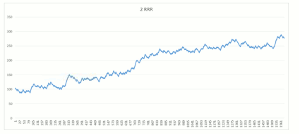
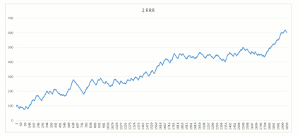
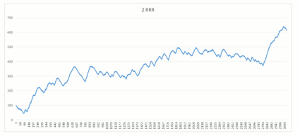
A back test was conducted for the period beginning April 2001 and ending in June 2015, which is a fairly long period. The average expectancy per trade is shown per currency pair and in total in the table below, using stop loss sizes of 0.5, 1, and 2 units of the 20-day average true range and various profit targets based upon reward:risk ratio. Spreads, commissions, slippage, and overnight financing are not factored in to the results.
It is obvious that this is a robust and profitable strategy over time, especially at the higher reward:risk ratios. There were, of course, almost twice as many trades triggered for 1 and 2 ATR than there were for 0.5 ATR, but interestingly, note how there was little difference in the positive average expectancies per trade between the stop loss levels. A good solution might be to use the higher ATRs where the lower ATR trades are not triggered.
One final word of warning: like all mechanical strategies, there were periods of severe drawdown, with approximately 3,000 trades for the 1 and 2 ATR strategies over the 14 year period and about half that number for the 0.5 ATR strategy.
To give an example, the maximum peak-to-trough drawdowns with exits at a reward:risk of 2 units were as follows:
0.5 ATR: 34 units
- ATR: 98 units
- ATR: 130 units
This is something to take into consideration when you plan your money management strategy, if you adopt this type of trend trading method.
Back Test Equity Curves
All are at a reward:risk ratio profit target of 2 units.
0.5 ATR stop loss:
1 ATR stop loss:
2 ATR stop loss:
By Adam Lemon, Contributor, DailyForex.com


