Anna Coulling, of AnnaCoulling.com, takes to the charts and shares why she feels it’s time to consider the four major currency futures of the Aussie, the British pound, the Canadian dollar, and the euro for the daily charts of the December contracts.
As we rush headlong towards the festive season—and the ECB bringing its own unique brand of drunken antics to the party with Draghi clearly overindulging—it’s time to consider the four major currency futures of the Aussie, the British pound, the Canadian dollar, and the euro for the daily charts of the December contracts.
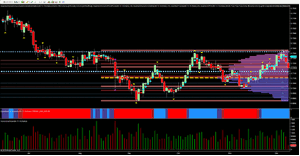
If we begin with the 6A and the AUD/USD, I suggested last week that the current rally for the pair was starting to run out of steam, with both the technical and fundamental picture beginning to weigh on the recent rally. Indeed, with Governor Stevens continuing to signal his desire for further Aussie weakness, the move higher was always likely to have limited momentum and it was the strong resistance in the 0.7360 area (denoted by the blue dotted line) that proved to be a bridge too far, with Friday’s long legged doji candle first signaling a pause point, which has since been confirmed with a solid move lower. This level is extremely strong and one that was tested repeatedly in August, and again in October, but duly holding firm on both occasions. Last week’s failure has reinforced this level still further, with the pair closing with a wide spread down candle in Monday’s trading session and continuing the move lower in early trading Tuesday to test the 0.7200 region at the time of writing. Below is the 0.7170 region where a platform of potential support awaits on the accumulation and distribution indicator, but should this be breached, then we can expect to see the pair move back to the volume point of control in the 0.7100 area in due course.
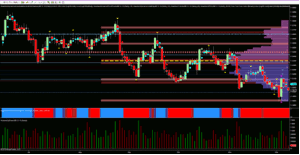
Moving to the British pound and the 6B futures contract, it was the ECB who provided the volatility, with Thursday’s wide spread up candle triggering the volatility indicator as the price action moved outside the average true range in this time frame, an unusual occurrence and one which laid the foundations for a trap, with the pair returning to the longer-term bearish trend once the dust had settled and now moving to test the 1.5000 region in early trading on Tuesday. With the low of Thursday’s candle now in place in the 1.4900 region, a return to test this area now looks increasingly likely, and should this be breached, the way will then be open for a deeper move to the 1.4600 last seen in April.
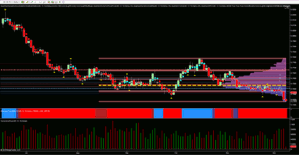
For the CAD/USD, the pressure exerted through the combined effects of falling oil prices and strength in the US dollar have proved too much, with the pair finally breaking away Monday from the extended congestion phase of November and early December on high and rising volume. This negative sentiment has continued in early trading Tuesday, and with the OPEC meeting now complete, and the current oil glut looking to increase once the Iranian sanctions have been lifted, the outlook for the CAD/USD continues to remain very bearish.
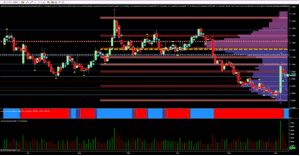
Finally to the euro, and the trickster in the pack, and again, the volatility indicator was triggered on ultra high volume following the ECB statement. As with the British pound, here too this price action has not been confirmed, with the pair retracing back into the spread of the candle as the short squeeze bit hard. Longer-term, the pair remain bearish, and once the floor of last week’s price action has been taken out in the 1.0500 region, then parity awaits in 2016.
By Anna Coulling, Professional Trader & Blogger, AnnaCoulling.com


