For many years, we have focused on the seasonal aspect of stocks. Traditionally, stocks perform well from November to April and not so well from May to October, observes Alan Newman, market timing strategist and editor of CrossCurrents.
This phenomenon was pioneered by Yale Hirsch and Norm Fosback and later used with phenomenal success by Sy Harding. We first encountered what we then called the “Dead Zone” at least 25 years ago and have modified it for the modern era.
This is a genuine phenomenon. The good six months account for 98.8% of all gains for stock since 1950 as measured by the Dow Industrials.

There are several reasons that contribute to this strange dichotomy, such as stocks being sold near the end of the year to capture the capital loss for income tax purposes and year end bonuses put to work early in the following year.
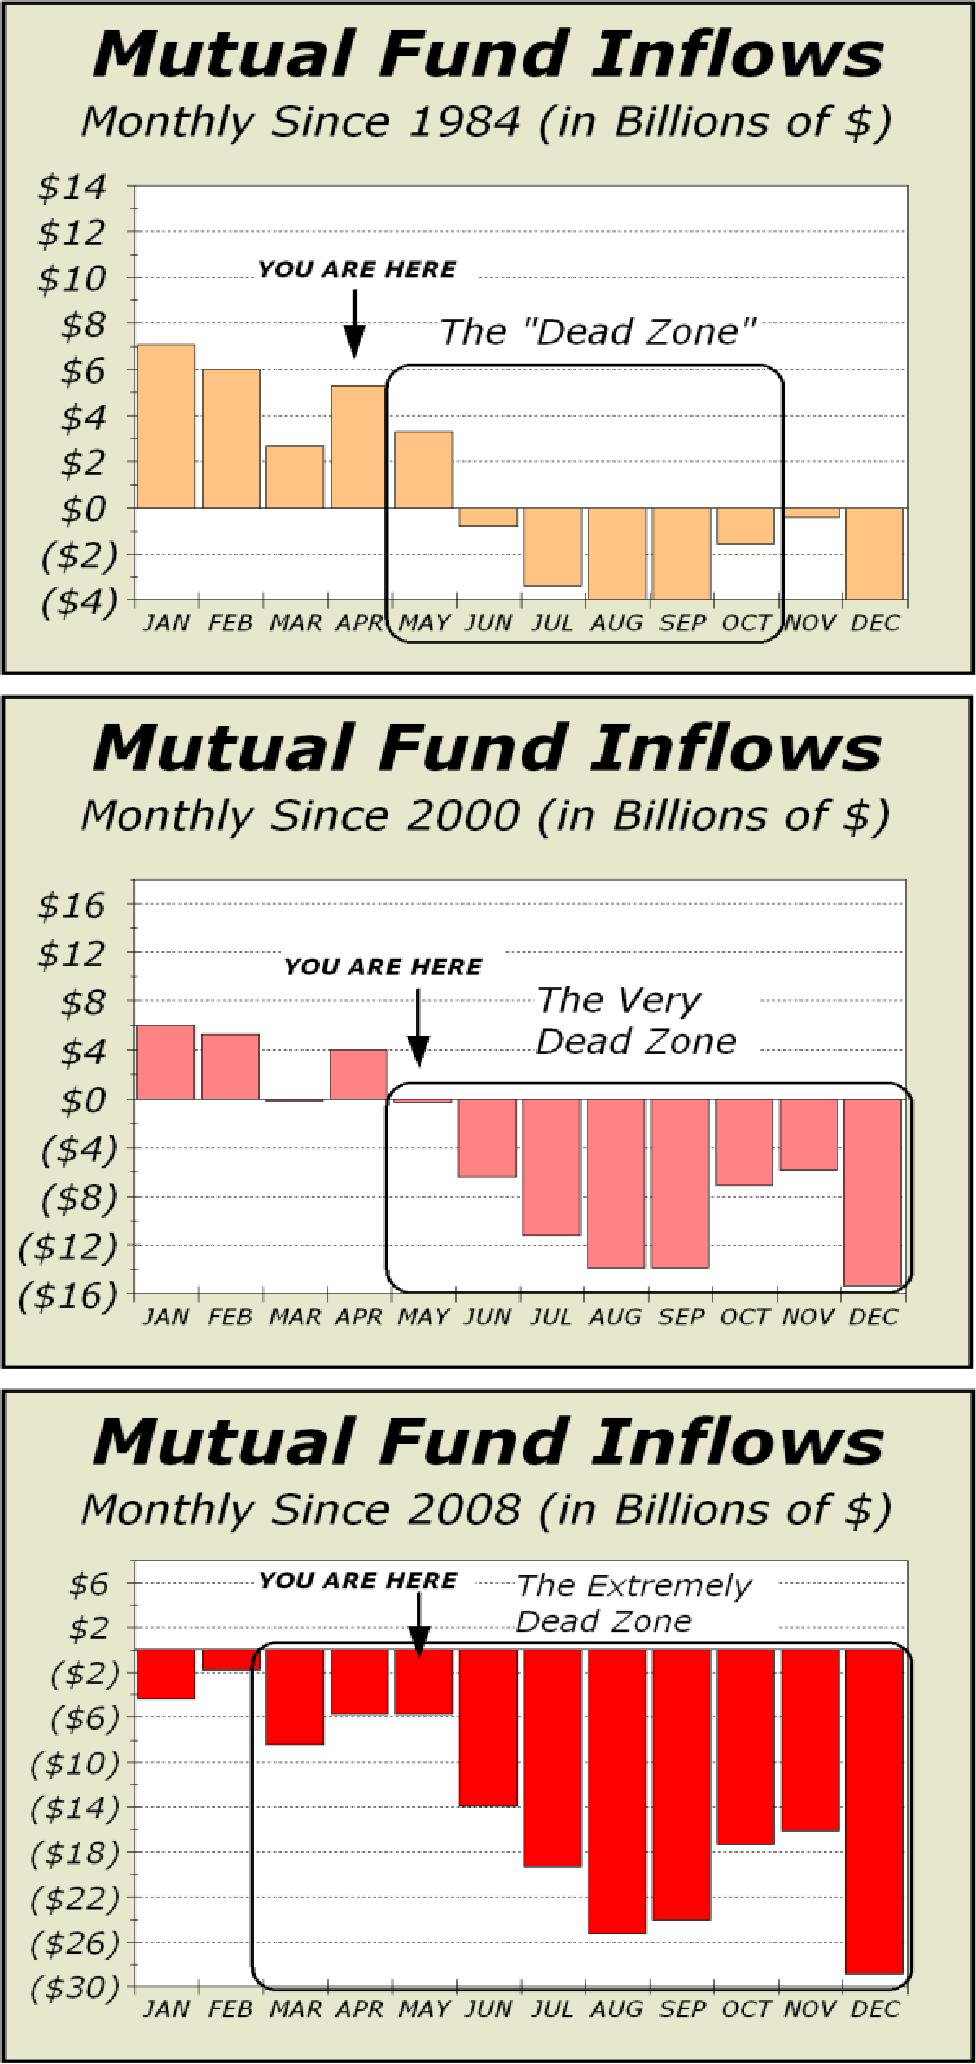
Our top chart clearly shows this dichotomy. Since 1984, the good six months account for 90.2% of all inflows. The pattern has survived for over seven decades and in fact, has become progressively bifurcated.
Since 2000, our Dead Zone has expanded to eight months and from 2008, the Dead Zone is ten months long. Thus, our analysis of the remainder of the year concludes that stocks are facing an enormous uphill battle. The Dead Zone points to lower prices at year’s end.


