
It’s been a sad state of affairs for the stock market. The market is clearly bearish and it’s been breaking records on the downside, going back to the 1920s, caution Mary Anne and Pamela Aden, editors of The Aden Forecast.
Stocks are set to fall further in an ongoing steeper bear market decline. Some of the reasons are high inflation, slow global growth, investors are scared, stocks are still very expensive, Ukraine war, higher interest rates, supply chain woes, China still in lockdown, lack of confidence in the Fed and the Administration, and fears of recession.
The technical signs are warning us it’s best to stay out of stocks at this time. This in turn could mean a recession is coming downstream because the stock market tends to lead the economy. That’s what happened in 1974, 1982, 2000 and 2008, for example, and it could indeed happen again.
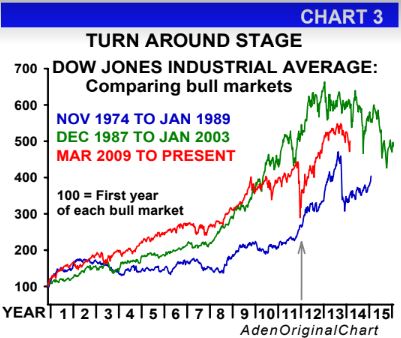
So far, the current bear is following the path of two previous bears (see Chart 3 below). And if this continues, and we believe it will, then stocks are going to fall much further. There are several technical reasons why... let’s take a look.
1) DOW THEORY CONFIRMATION
First off, the Dow Theory fully confirmed the bear market this past month. This happened when the Dow Transportations broke down below its September 2021 low.
By doing so, it confirmed the low in the Dow Industrials reached in March 2022, erasing any doubt as to whether the Dow Theory had confirmed earlier this year or not. There had been some debate on this. But now there is no question — the major stock market trend is down, based on Dow Theory and we believe the great Dow theorist Richard Russell agree.
2) PTI
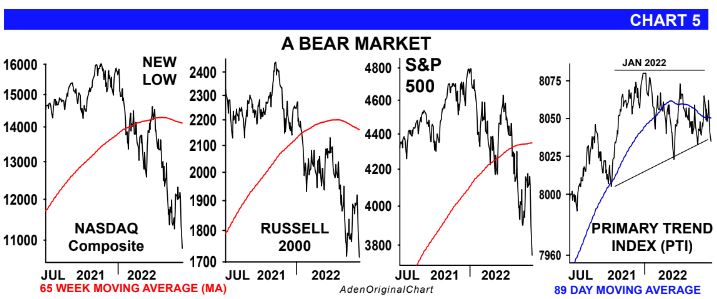
Currently, Richard’s famous Primary Trend Index (PTI) is bearish to neutral (see Chart 5, below). It’s been topping since last year and it’s near its moving average.
These are bearish signs but, like the Dow Theory, it would clearly turn bearish if it breaks and stays below its 2022 low.
3) Adv/Dec: At new lows
Meanwhile, the Advance-Decline line is also hitting a new low and it’s clearly bearish (see Chart 6 below) The Advance-Decline line measures the breadth or internals of the market. That is, how many stocks are rising versus how many are declining, so it shows what’s really going on under the surface. It also shows how broad or narrow market participation is, which is important for the overall outlook.
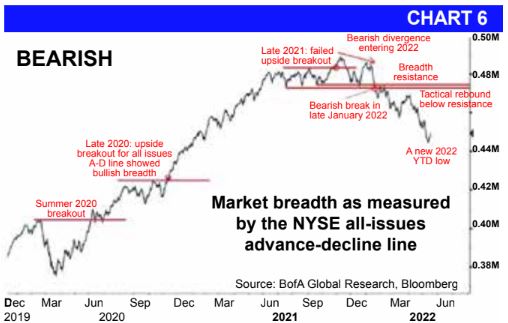
This year’s breakdown illustrated the underlying weakness in the overall stock market. It was a market that lacked good leadership and we’re now seeing the results of this as most stocks head lower, including the former star performers, which have lost trillions.
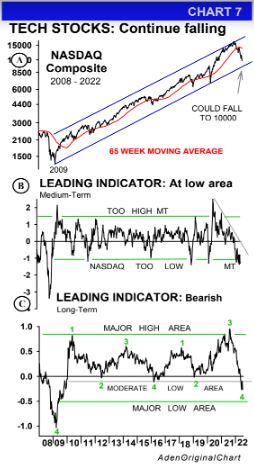
This is not good news and neither are the messages we’re getting from our leading indicators (see Nasdaq on Chart 7 below) as an example because basically they’re all signaling the same).
4) Bearish indicators
As you can see on the top chart (chart 7), Nasdaq is now clearly declining within its 14 year upchannel. And for now, it looks like Nasdaq will keep going down to near the 10,000 level, which is at the bot- tom of the upchannel.
The leading (long-term) indicator has also declined below the moderate low area (see chart 7, section 3 above). If it now stays below this level, there’s a good chance the indicator will fall to an extreme low, like it did in 2008.
If it does, it would reinforce the likelihood that Nasdaq is indeed going to experience a severe bear market. The other stock indexes will too. We believe this is going to happen. We hope it doesn’t, but most of the signs are pointing this way.
Plus, it wouldn’t be unusual considering the unprecedented amount of money that was created due to Covid. Bascially, this created a gigantic stock bubble that's now popping.
The global stock markets are reinforcing this as well. They’ve had their worst year so far in recent history. And they’re all still bearish as well. The bottom line is, our recommendation remains the same. It’s best to stay on the sidelines and avoid the general stock market for the time being.


