During the final week of April, many investors and members of the financial media were asking if it was prudent to heed the old Wall Street adage to “sell in May and go away.” The better option may be “Rotate, don’t retreat,” opines Sam Stovall, chief investment strategist of CFRA Research.
The “strongest six months of the year,” popularized in The Stock Trader’s Almanac, tells us that the price return for the S&P 500 from November through April (N-A) has recorded the highest average price change of any rolling six-month period.
This pattern has also been true for the Russell 2000, MSCI-EAFE, and MSCI-Emerging Markets indices, as they recorded average six-month returns of 6.6% (since 1945), 9.1% (since 1979), 8.7% (since 1969), and 9.6% (since 1988), respectively.
What’s more, the frequency of posting a positive six-month performance ranged from 73% for the Russell 2000 to 80% for the MSCI-Emerging Markets index.
Conversely, the “sell in May” adage reminds investors that the average May-through-October (M-O) price returns have historically been anemic, not only for large-cap U.S. equities, but also for the small-cap, developed international, and emerging market indices, as they recorded average six-month returns of only 1.6% (for the S&P 500), 0.8% (Russell 2000), -1.3% (MSCI-EAFE), and -2.1% (MSCI-EM).
In addition, the N-A return for each of these four benchmarks outpaced their M-O returns 65% to 79% of the time. Yet, the frequency of posting a gain during this M-O period of seasonal softness ranged from as low as 43% for the MSCI-EM index to 65% for the S&P 500.
Finally, the presidential cycle has amplified this seasonal rotation. This year, which is a pre-election year, history reminds us that while the market soared an average 14.3% in the N-A period (and rose in price 95% of the time), it still faced challenges in the subsequent M-O period, gaining just 2.0% (and higher 63% of the time), implying that it continued to be wise to “rotate, not retreat.”
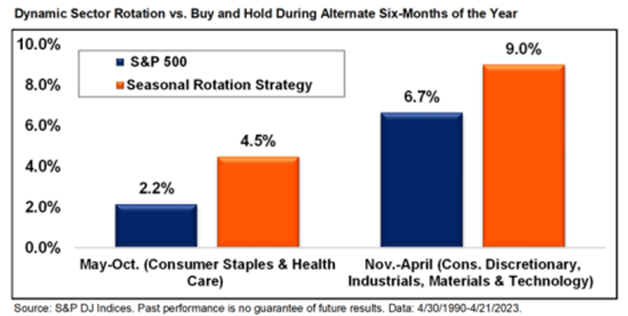
So, where does history say one should go? Some sectors will have their day in the summertime sun, while others skate along smoothly in winter. Since 1990, while the overall market was eking out an advance of 2.2% during the challenging M-O period, the defensive S&P 500 consumer staples and health care sectors recorded average price gains of 4.5%.

Conversely, as the S&P 500 recorded its strongest six-month return in the N-A period, the cyclical consumer discretionary, industrials, materials, and technology sectors as a group outpaced the market as a whole. Indeed, since 1990, while the S&P 500 gained 6.7%, average price gains from equal exposure to these four sectors returned 9.0%
From 4/30/90 through 4/21/23, a hypothetical portfolio that owned an equal weighting of consumer staples and health care sectors from M-O, but then rotated into an equal exposure to the consumer discretionary, industrials, materials, and technology sectors from N-A, saw higher returns relative to its benchmark, lower volatility, and a 68% to 71% frequency of beating its benchmark.
Recommended Action: Rotate, don’t retreat.


