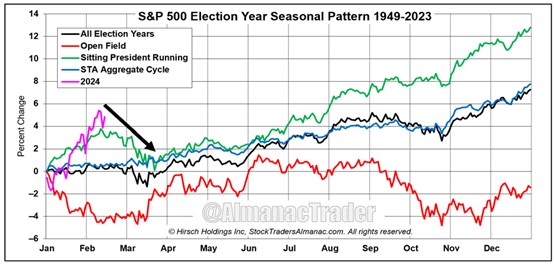
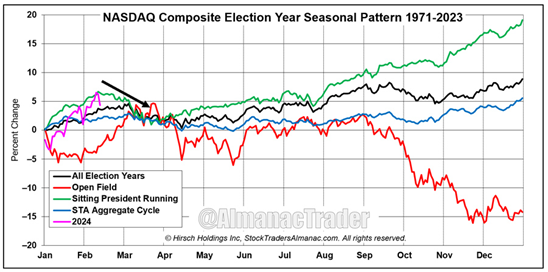
Mid-February just arrived and with it the probability of some market weakness in the near term is on the rise. February is the weak link in the Best Months and as we have pointed out on several occasions, its average performance in election years, since 1950, has been tepid, explains Jeff Hirsch, editor of The Stock Trader’s Almanac.
Zooming out to the familiar full-year seasonal pattern of the S&P 500 and the recently created NASDAQ chart, through the close on February 14, we see both indexes tracking the “Sitting President Running” seasonal pattern rather closely.
Both S&P 500 and NASDAQ patterns have peaks around mid-February followed by modest weakness into March before the rally resumes. When comparing NASDAQ’s election year patterns to S&P 500, please note NASDAQ data starts in 1971, which means the NASDAQ has five less election years than the S&P 500. As a result, the bearish “Open Field” election years 2000 and 2008 have a greater impact on NASDAQ’s average performance in those years.


In addition to seasonal patterns, sentiment may also be signaling a potential market pause and dip. Yes, many sentiment indicators have reached bullish levels not seen since late 2021 or early 2022, but we do not believe this alone is a signal that a sizable and damaging market pullback is imminent.
Outside of geopolitical concerns, the market’s expectation of Fed rate cuts is the most likely catalyst for a modest pullback in line with historical patterns and seasonal trends in the near term. Last week’s CPI reading was a reminder that inflation has not been fully tamed by the Fed yet. When Treasury bonds yields jumped in response, the market briskly retreated that day.
Beyond some potential seasonal weakness, we remain bullish for the remainder of the year and our bullish base case scenario of full-year gains in the 8%-15% range is still in play. The timing and magnitude of rate cuts, elections, and geopolitics are likely to contribute to some choppiness along the way.


