
Markets are back near, at, or above all-time highs and the question everyone is asking is, will we continue higher? Recent moves suggest we could see further gains, but that could change quickly. As a trader, identifying the right time to get into a position is key and there are patterns and signals that can guide you in the right direction, counsels Gav Blaxberg, CEO of Wolf Financial.
Knowing what to look for can help improve the odds that you are on the right train, going in the right direction when the market makes a decision. Here are a couple patterns and signals to be familiar with, especially with markets at these levels.
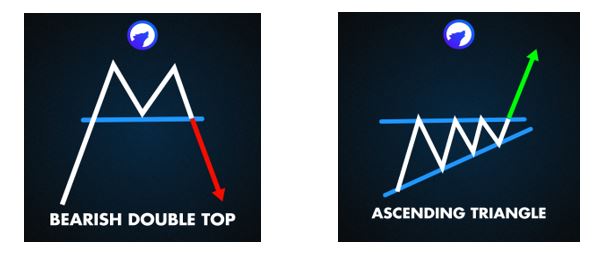
First, a double top pattern is a classic bearish reversal pattern. It occurs when the price reaches a high, pulls back, then rises to the same high again before falling. This pattern resembles the letter 'M'. The confirmation of this pattern is a break below the neckline (the low point between the two highs).
Second, an ascending triangle is a bullish continuation pattern. It forms when the price makes higher lows while encountering resistance at the same level. A breakout above the resistance line can signal a continuation of the uptrend.
Identifying these patterns and their key levels early will allow you to take optimal entries when the trade starts to take shape.
In addition to patterns, there are also important signals to watch for.
Volume is a crucial indicator to watch when markets are near highs. An increase in volume can confirm the strength of the uptrend. However, if the market is making new highs on decreasing volume, it could be a sign of a potential reversal.
Momentum indicators like the Relative Strength Index (RSI) or the Moving Average Convergence Divergence (MACD) can provide valuable insights. If these indicators are not making new highs along with the price, it could indicate a bearish divergence, signaling a potential reversal.
Moving averages can act as dynamic support and resistance levels. If the price is above a rising moving average, it can indicate a strong uptrend. Conversely, a break below the moving average could signal a potential reversal.
Knowing what to look for and then acting on the information you have are two big steps towards becoming a consistent and successful trader.


