
At Learning Markets, we tend to focus more on price patterns, support and resistance, and candlesticks over technical indicators when using technical analysis. This is useful because the data doesn't lag like a technical indicator does.
When the price moves in a given market, we can see buy and sell signals in real time using price patterns rather than waiting for the data to be filtered over time within a technical indicator. Gaps are an example of a price pattern that can provide very dramatic trading signals.
Gaps occur when the market opens a session higher than the previous high or lower than the previous low. Gaps look like a blank space in a bar or candlestick chart between two trading sessions. They are most common in markets that close and do not trade overnight.
Gaps are sometimes ignored or misunderstood by traders. One of the reasons this may be true is the emergence of "gapless" markets like the forex. However, once you understand the drivers behind a price gap, these same signals can be found within a "gapless" market as well.
To begin this series of articles, I will define three of the most common gaps usually seen on a price chart. I am using Apple, Inc. (AAPL) in this case study so that you can evaluate the same signals within your own charting application as you practice identifying gaps.
Common Gaps
A common gap is usually small and occurs when a stock is channeling or consolidating in a tight range. In the chart below, you can see an example of this kind of gap in the red areas on Apple, Inc. (AAPL). A common gap is not very useful because it occurs within a range-bound market. Because range trading is very common, this is the kind of gap you will see most often.
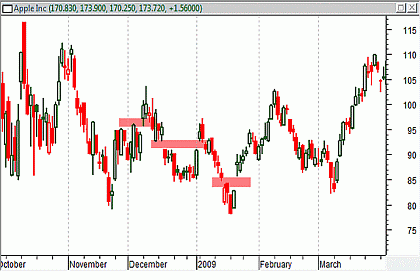
Click to Enlarge
Breakaway Gaps
Periodically, a stock will break out of a trading range and break support or resistance levels. When that occurs with a price gap, the signal is definitely one that traders should pay attention to. In the chart below, you can see this kind of bullish breakaway gap on AAPL when the market broke out of a consolidation pattern and gapped above resistance.
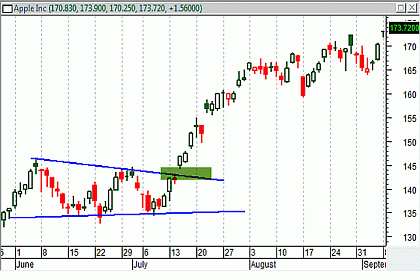
Click to Enlarge
Continuation Gaps
A continuation gap occurs when the market is already strongly trending one direction or the other and a gap between two trading periods occurs. Like breakaway gaps, a continuation gap to the upside is considered bullish and a continuation gap to the downside is bearish. In the chart below, you can see a continuation gap that occurred after a breakaway gap in AAPL.
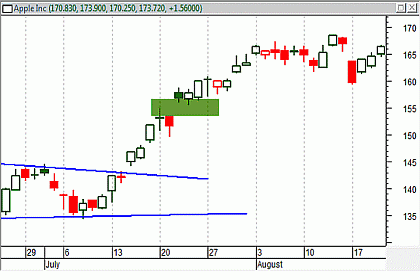
Click to Enlarge
Gaps are caused by information or changes in investor sentiment that is released when the market is closed or not trading. This is seen most often in the stock and option markets where pre- and post-market news is common. That news can change the perceived value of a stock, and as a result, the buy/sell equilibrium will be different at the next open from the prior close.
In the next articles in this series, I will cover some of the basic ideas around using gaps to identify support and resistance, buy signals, and changes in investor sentiment. You will also learn how the causes of gaps can be identified in "gapless" markets so that the same signals can be traded there.
Watch the video for more information:
By John Jagerson of LearningMarkets.com.


