
Divergences can be an important warning signal that a bullish trend is ending. Besides describing a bearish divergence with the CCI indicator, I will further refine divergence analysis to help you understand what types of divergences matter most and what you should be looking for on a day-to-day basis.
A bearish divergence occurs when prices continue to form higher highs (typical in a bull market) while your oscillator (CCI) is forming significantly lower highs (indicating weakness in the trend.) We have further defined this signal as a period of diverging trends between prices and the indicator when the indicator has been making peaks in the "overbought" territory.
If you are using the CCI to look for divergences, that means that you will pay the most attention to divergences when the indicator's peaks are above its normal range. You can see exactly this sort of formation and the resulting downtrend on the chart below of the US dollar index.
There are two things that a technician can do once a divergence forms and prices start to drop. First, it is an opportunity for long traders to be proactive about their risk control. That may mean using tighter stops, protective options, or just reviewing your portfolio to make sure you are properly diversified. Second, a bearish divergence is a great timing signal for more speculative traders to get short the market or to buy put options. In either case, the signal has given you actionable information for your own portfolio management.
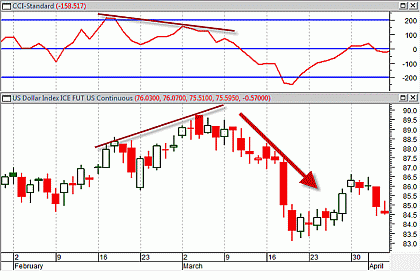
Click to Enlarge
Sometimes, a technical indicator will disagree, or even seem to “fight” with the actual price action of the stock or index you are analyzing. These “disagreements” are actually very useful for technical traders. In part two of this series, we will look at the bullish version of these disagreements or divergences.
A divergence appears when an oscillating technical indicator (in this case the CCI) begins to establish a trend that disagrees with the actual price movement. For example, in the chart below, you can see the gold ETF (GLD) forming slightly lower lows in April. This is representative of a market that is becoming more bearish. However, the CCI technical indicator I have applied is showing a series of higher lows, which is indicative of an improving trend.
For GLD shorts, this is a warning that risk control is going to become much more important because there is a high probability that the trend will be disrupted in the short term. For more speculative traders looking to get long GLD or buy call options, this bullish divergence is an alert that a change in the trend may be emerging.
When looking for divergence patterns, it is helpful to trade with the prevailing trend and/or a breakout from a consolidation level. As you can see in the chart above, both conditions were true. Gold had been trending up since the prior year and the market was consolidating in a descending wedge (usually a bullish pattern).
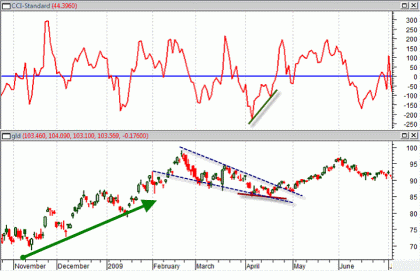
Click to Enlarge
Traders use oscillating technical indicators like the CCI because they filter a lot of the noise within the price action. In addition, oscillators are typically designed to show a trader when prices have reached extremes and a reversal is likely, which makes them ideal for divergence analysis.
By John Jagerson of LearningMarkets.com


