
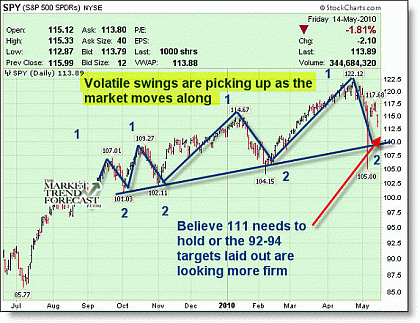
Back in the third week of April, I predicted a topping in the broader market indices. The theory was that the VIX levels were extremely and historically too low, concomitant with extremely high historical readings in investor bullish sentiment gauges. After 13 Fibonacci months of a bull cycle rally, it was likely an ABC correction to the downside would begin. In further follow-ups on TheMarketTrendForecast.com service I run on April 20, I again outlined concerns with falling volumes on small cap stocks, and too many “stories” being run up too far ahead of the economics.
At this point in the bull market, it is common to have the crowd of investors move from a bias towards viewing all news as positive to a negative slant on all news. Nothing has changed dramatically on the problems the world had before with debt and currencies, but the reaction to those events turns negative. This works off the overly optimistic Elliott Wave patterns of the crowd, turning into a typical zigzag correction that lasts several months. There will be trading opportunities between that mid-April topping forecast and my forecast for a bottom around mid-September. However, as recommended in April, index investors and mutual fund investors should have been moving to the sidelines. I am looking for the S&P 500 index to drop to the 920-970 areas by mid-September before the next leg of the bull market takes off.
Click to Enlarge
Now, the one caveat to that forecast is actually a lot more bullish. If the S&P 500 can hold the 1100-1110 areas and pivot up strongly, we could move on to new highs. I put the likelihood of that around 20%, so be on guard. A countertrend rally up in the next few weeks is highly probable, but the evidence continues to suggest working our way down into the 900’s in the S&P 500 before the bull resumes in earnest. We are selectively buying gold and biotech stocks in the Active Trading Partners service as well.
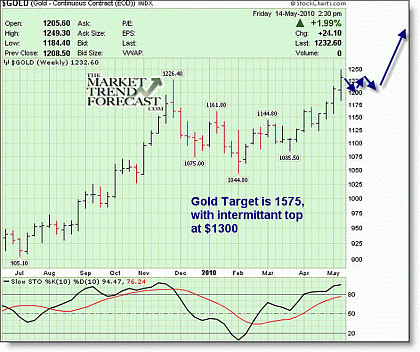
Gold has continued higher, confirming my April forecast of a move from $1125 to $1235 in gold. The Elliott Wave patterns remain extremely bullish for gold to continue a 13 Fibonacci-year cycle up into 2014. Gold has formed a very bullish pattern intermediately for a move to $1470-$1550 at the next major pivot top. In the interim, I expect continued consolidation in and around my $1,235 US levels before the next pivot high at $1300-$1,325 US.
Click to Enlarge
Fiat currencies are burning matches as foreign governments and other entities continue to attempt to put out a fire by printing more paper and covering the same fire with it. Until the analysts on CNBC stop questioning the validity of gold and start questioning the validity of fiat paper, the bull will rage onwards, with most of the pundits watching the caboose from the back of the tracks.
By Chris Vermeulen of TheTechnicalTraders.com


