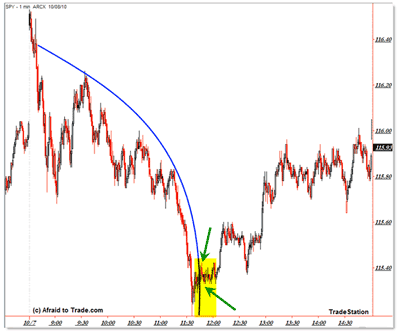
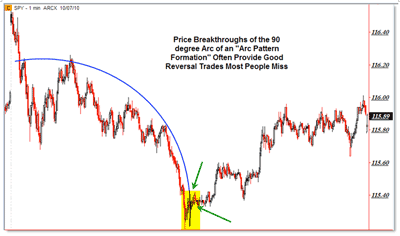
Last Thursday’s intraday activity in the markets gave us a great example of the not-so-common pattern of an arc trend line reversal break (I’m sure there could be a better name for that), which is a good opportunity to play a reversal trade off a price climax low.
Let’s first see the pattern, learn the concept, and find out how to trade it when it happens again.
First, the bigger picture:
Now, let’s see the smaller, “pure-price” image:
In each night’s member report, I try to give an in-depth explanation or lesson in a particularly good example of a trading tactic, strategy, or concept (in addition to the “Idealized Trades” section and “Forecasting Tomorrow” portion).
The brief lesson from yesterday was clearly the “arc trend line reversal” opportunity.
The logic goes as follows:
Typically, traders draw linear trend lines and never think to draw arc, or sloping trend lines. Sloping trend lines—which often form arcs—take into account price acceleration and dynamics (price is not always linear).
Anyway, without getting too detailed, the main idea is to observe and connect price highs (or lows for a rising arc) that may be forming an arc pattern in real time.
Then, look for a sharp selloff (as we saw above) that forms the right side or 90-degree angle (from the top) point.
Think logically. Price can do anything, but one thing price cannot do is complete a full circle on the chart. Right? Price can’t go backwards, after all!
So, when price breaks free from a sharply plunging momentum move that has created an arc trend line pattern similar to that above, it’s a good spot to do two things:
1. Take off any short-sale trades for a profit. You can always re-enter if price continues to fall after an initial retracement up.
2. Put on a reversal style, “aggressive buy” trade on the breakout from the arc trend line.
Putting on a new trade to play for a reversal is aggressive and not required, but it is a safe/conservative play to lock in some profits on an arc trend line break such as this.
Why?
These patterns often highlight short-term capitulations in price at exhaustion points. It’s similar to a “sell climax,” or “V-spike reversal,” where sellers are exhausted and buyers rush in to find “cheap” value.
Either way, the result often is a short-term price trend reversal that you can trade intraday.
When entering on such a trend line break (entry doesn’t have to be perfect), put a stop just under the intraday low and trail it up perhaps under a short-term moving average (20-period EMA, for example) or exit the position into the close if price kept on rising for the remainder of the session.
The absolute worst thing to do would be to get aggressively short at the low, thinking the downswing will continue forever. Odds are it won’t.
Take a look at the pure price pattern for additional insights and helpful trading tactics.
By Corey Rosenbloom, trader and blogger, AfraidtoTrade.com


