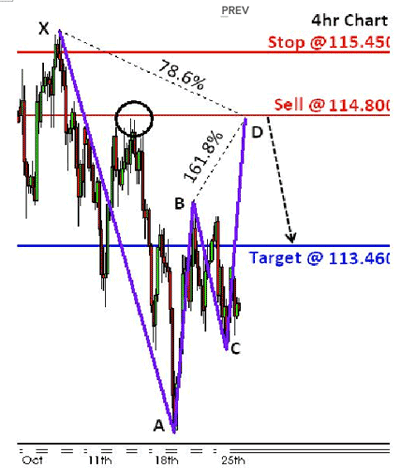
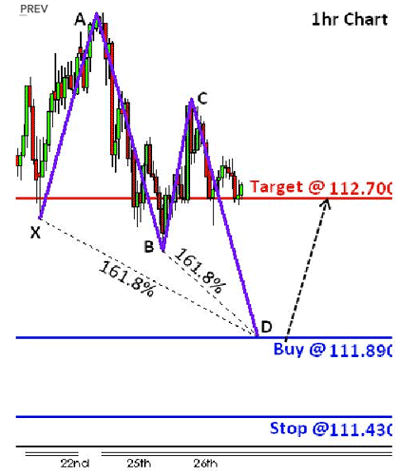
The EUR/JPY chart is an example of recent symmetry creating multiple opportunities. There are several patterns forming, but we will only analyze the two we feel are most important for our feature. We will be going over a bearish Gartley and a bullish butterfly.
First, we will go over the bearish Gartley. We are looking to sell the EUR/JPY if it rises to 114.80 at point D. Point D is located at the convergence of the following points:
- 78.6% Fibonacci retracement of XA
- 161.8% Fibonacci extension of BC
- AB=CD
We would place our stop for the bearish Gartley at 115.45. Our initial profit target would be 113.46 (61.8% of CD). The trade is invalid if the pair drops below 112.30 before reaching the entry.
Now we will go over the bullish butterfly. We are looking to buy the EUR/JPY if it falls to 111.89 at point D. Point D is located at the convergence of the following points:
- 161.8% Fibonacci extension of XA
- 161.8% Fibonacci extension of BC
- AB=CD
We would place our stop for the bullish butterfly at 111.43. Our initial profit target would be 112.70 (61.8% of CD). The trade is invalid if the pair rises above 113.30 before reaching the entry.
We do not know if the pair will move up or down from where it is now. We are simply saying we will sell if it rises to 114.80, and we will buy if it falls to 111.89. As always, we will watch for long bars in the CD leg of either pattern, assuming one of them completes over the course of the next day. If we see long bars in the CD leg or the pattern accelerates into the entry, we will be weary of taking the trade.
By Bradley W. Gareiss, technical analyst, GFTForex.com


