July's expiry (on July 16, 2010) was a perfect example of correlation of the US market with the US financial sector and the US banking stocks. All three groups were moving in the same direction. As an options trader, one should also be sure to align an appropriate option strategy with the movement of the market, sectors, and stocks.
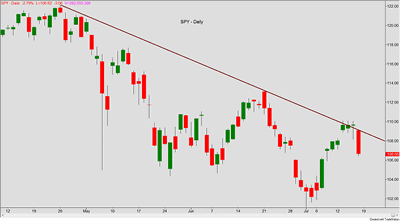
Starting with the daily chart for the benchmark of the US broad market, Figure 1 below shows the S&P 500 exchange traded fund, SPY, coming into a strong diagonal descending resistance. On Tuesday, Wednesday, and Thursday, all three consecutive bars closed in a higher range.
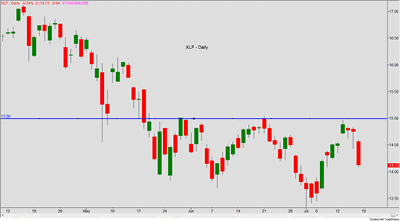
However, as early as Thursday, July 15, 2010, by closely monitoring the 12 US sectors, it was easy to observe that the weakest of the 12 were the financials. The ticker, which I personally use to track the performance of the financials, is XLF. The chart below shows the daily chart of the XLF.
Observe on Figure 2 above that I have marked the 15.00 zone as a major area of resistance. Hence, when swing trading, I like to see that both the broad market, the sector, as well as the stock of my focus are all coming at the same time to their respective turning points. On the ES chart (Figure 1), we have already observed a descending bearish line; on XLF, the resistance line was not diagonal, but a horizontal one.
Having the bigger picture in place, both market and sector, my forecast was towards the bearish camp. Just like the lions in Africa prey upon the weakest gazelles, so should traders in bearish market conditions select the weakest herd (sector) and then zoom in on the limping gazelle. After a quick glance through the major banks, I chose Bank of America (BAC).
Article Continues on Page 2
|pagebreak|Having the forecast for (1) Market, (2) Sector, and (3) Stock still does not equal a profitable option trade. The majority of novice option traders know only to buy a long put (a bearish play) or to buy a long call (bullish trade). In the environment that we have on BAC prior to their earnings, the last thing that an option trader should be doing is buying single-legged directional calls or puts. Why? The reason is simple: Due to the high implied volatility (IV). The official Online Trading Academy teaching is that when the IV is high, do not buy, but sell options. To make a trade clarification, to sell options does not mean to be naked, uncovered, or exposed. What it means is to sell hedged or covered options. We are not talking here about covered calls, but about being covered by another option.
For instance, in a bear call, we sell the strike price above which we believe the underlying will not close at expiry. On the XLF chart, that would be the 15 call. For BAC, things get a bit fuzzier depending on the option trader's level of tolerance for risk. Specifically, on Thursday, BAC closed at $15.38, hence, selling the 15 call could be considered an aggressive option trade, while selling the 16 call would be somewhat moderate to conservative. In both cases, BAC at July expiry the next day had to close below the sold strike prices. For the 15/16 bear call, below the 15 call, and for the 16/17 bear call, below the 16 call. Once the lower or sold strike prices are selected, the option trader focuses on the purchase of the higher strikes in order to hedge or insure the lower (sold) strike price.
In the aggressive bear call, the sale of a 15 call, while the BAC is at $15.38, would mean the July 15 call is ITM (in the money) by 38 cents. Buying the 16 OTM (out-of-the-money) call means BAC would need to drop at least 38 cents or more for the 15/16 bear call to be profitable. This is seen as an aggressive trade because we are forcing it to move in order to be profitable. Conservative trades are those in which there is no need for a move to be made for profitability. Selling the 16 call and buying the 17 call means that BAC does not need to do anything but stay below 16.
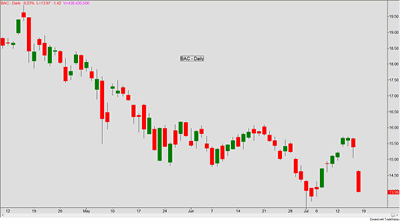
The figure above shows the daily chart of BAC with the closing prices of Friday, July 16, 2010). Friday was both the July expiry and BAC earnings release date. What appeared to be an aggressive short 15/16 vertical call spread turned out to be an excellent options trade. Why? Because the market and sectors are stronger and more important indicators of the trend than the individual stocks.
Secondly, the moderate to conservative bear call, or short 16/17 vertical call spread, would have worked out well, too. However, the rate of return on the investment would not be as high as for the more aggressive one. The higher the risk, the greater the reward, and vice versa; the lower the risk, the lower the reward.
In conclusion, when trading options, it is wise to ensure that the stock, sector, and the general market are all moving in the same direction. At that point, check the IV and accordingly select the option strategy either for buying or selling.
By Josip Causic of Online Trading Academy


