
By Fred Oltarsh
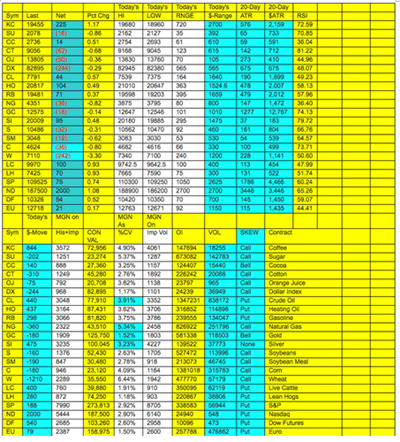
Compiling information that can help traders initiate options and futures positions is a difficult task. However, many experienced traders look at the same information on a daily basis. My goal is to share the options and futures information that traders find useful with those who don’t ordinarily know where to look. The chart below provides daily settlement information, which helps traders understand historical and implied volatility, skew, options settlement information, and statistics regarding average trading range, relative strength, volume and open interest, and other useful information.
Wheat was the most volatile commodity today. It moved down 3.30%. The implied volatility of wheat, however, remained below both its 30- and 60-day historical volatility. I’m sure wheat won’t trade below its historical volatility forever, but it’s trading at a discount now and to not consider putting on a long vega, long gamma options position would be a shame. If you don’t have a market bias in wheat, comparatively cheap options can provide interesting trading opportunities with the purchase of straddles or strangles. If you’ve never traded a long gamma position, it is potentially quite entertaining and profitable. Call me to discuss the possibilities.
On a nightly basis, I analyze the information contained in the chart below and use that information to help clients establish the best positions possible to meet their trading goals. All options traders should understand the importance of implied volatility as it relates to historical volatility. They must understand the subtleties of each futures contract and the leverage it provides. Trading options contracts without the appropriate information and knowledge puts the trader at a distinct disadvantage.
The chart below is designed to provide information that options traders need. I used this information as an options market maker and as head of risk at NYBOT/ICE Futures.
Click to Enlarge
Click to Enlarge
Here’s an explanation of some of the lesser-known columns:
There is the 20-day average trading range and its dollar value followed by the Relative Strength Index (RSI), a measure of overbought or oversold situations.
“Mgn on His” and “Imp” represents our calculation of reasonable margins based on the average of the ten-, 30-, and 60-day historical volatility and the implied volatility.
“Con Val” is the current value of the contract and “%CV” is the margin as a percentage of the contract value.
“MGN on Imp Vol” is a margin calculation based on just implied volatility. (These margins are our own estimate of reasonable margins and should be used for analytical purposes only—they are not exchange margins. Margin estimates are always too high or too low, but are interesting for risk analysis purposes.)
“Skew” represents the direction of the options skew in the market.
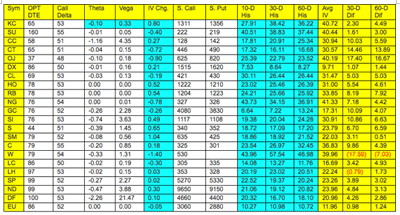
“OPT DTE” is option days to expiration.
“S. Call” and “S. Put” are the settlement price of the at-the-money strike.
“30-D Dif” and “60-D Dif” is the difference between the implied volatility and the 30- and 60-day historical volatilities.
If you have any questions pertaining to how to use this chart or would like to discuss certain market opinions, please feel free to call me at 347/949-4546 or 212/383-9453 or contact me by e-mail at fred.oltarsh@libanman.com


