
One option trader is looking to go long Citigroup after the company this week announced a reverse split and dividend. Here’s the technical reasoning for the trade and how it would be structured.
By Greg Harmon
Citigroup (C) made big news on Monday with its one-for-ten reverse stock split and commencement of a one-cent dividend.
The reaction ranged from a discussion of the impact on “rebate” traders (an equity trading style that uses electronic communication network (ECN) rebates as a source of profit and revenue), to the fact that institutions will now be able to own it since the share price has been forced to over $5/share. Some traders even discussed how a higher price will make a better opportunity to short it.
I have not seen any financial analyst calls on it recommending a buy, a sell, or whatever. And from a purely economic perspective, this makes sense. No capital is created or destroyed. Just cut the price by ten and be on with it. As a technical analyst, the talk of institutions got me looking again at the longer-term charts for an idea.
My technical analysis call: Get long this stock with options; just not right here.
Let me explain with a couple of charts, beginning with the monthly chart below.
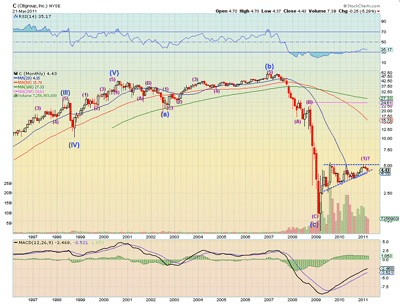
Click to Enlarge
This chart analyzes Citigroup from an Elliott Wave perspective. The March 2009 low was the end of a corrective wave and then a new motive wave began. With the potential topping occurring, this may be the point to add a “(1)” that marks the end of the beginning impulse wave, or it may continue higher and the “(1)” is still a ways off. Either works for a long-term investor as a bottom has been put in. Now shift to the ascending triangle at the end of the monthly chart, which is blown up on the weekly chart below.
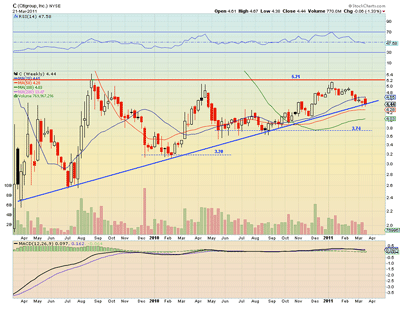
Click to Enlarge
The weekly chart shows several touches of the bottom of the ascending triangle and a new one on Monday, March 21. If there were a break below the rising trend line (remember this picture only shows Monday on the last weekly candle) of the triangle, then there are many support points including the 50- and 100-week simple moving averages, the round figure of $4, and the previous support at $3.74. I want to be long Citigroup on a break over $5 or if it falls to $4. If I could capture upside gains in between without risking anything, that would be great too, and here’s how to do it.
Risk Reversal
The risk reversal trade is a bullish bet buying an out-of-the-money call and selling an out-of-the- money put to fund it. The table below shows the prices for the September expiry for Citigroup near Monday’s close. The play here is in the September expiry to buy the 5-strike call and sell the 4-strike put for a net credit of two cents. (Be sure to check current pricing at the time of executing any trade.)
If the price closes above $5 on September 16, then you exercise or sell the call and own the stock at $5 or pocket the gain. If it falls below $4, then the stock is put to you and you own it at $4. In between, if the stock price rises to $5 early, then you can sell the call for a gain.
Available options are below:
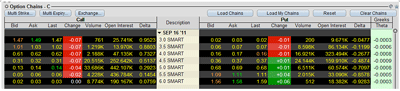
Click to Enlarge
Variation
If you cannot sell naked options, then “spread” the sold put by buying the 3.5-strike put. This leaves you with a bullish call on the 5 strike and a bullish put spread short the 4 and long the 3.5 strikes. This also limits the downside potential to 50 cents at maturity, but it will cost five cents for the package. If that is too expensive, add a sold upside 5.5-strike call at a five-cent credit for a net cost of zero.
By Greg Harmon of DragonflyCap.com


