A double calendar is a range-based trade, which has a wider break-even range, and therefore a larger probability of making a profit, writes Russ Allen of Online Trading Academy.
Last time, I wrote about calendar spreads and demonstrated how they could be used as a directional spread, relying on underlying price movement, instead of a range-based "theta play" (a trade that profits from time decay as long as price stays in a range). My directional example was bullish, but calendars can be used as a bearish position too.
Today we'll look at what happens when you put two calendar spreads together. This results in a trade that also is range-based, like the neutral single calendar. But instead of having a profit peak at just one strike price, it can make most of its maximum profit over a wider range of prices. Like the single calendar, the double calendar benefits from an increase in implied volatility. In this way, it is different from the iron condor, another popular range-based theta play. The iron condor is best used in times when IV is already high and expected to fall; the double calendar when IV is low and expected to rise.
Last week, with SPY around $161, we compared two September/July SPY call calendars; a neutral one at the 161 strike, and a bullish one at the 168 strike. The 161 calendar was neutral, and would benefit from SPY staying as close to 161 as possible. Its profit depended mainly on the quick loss of time value in the July calls.
The 168 calendar was not neutral. With a strike price $7 above the price that was current at that time, it was bullish, depending on an increase in the price of SPY for its profit. The increase in price of the underlying would push up the value of both the July and the September options; but the short July one would expire soon, leaving the long September one with two months of time value. We would then sell the September options and cash in that time value.
Each of these two calendars would benefit from an increase in IV, as the greater time value in the long September options would increase more than that in the short July options.
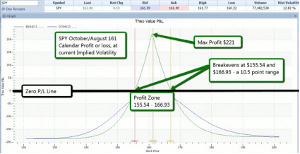
Since some more time has gone by, the current choice for the calendar spread would be the Octobers for the long side (which should be more than 90 days out) and August for the short side (which should be less than 60 days out, but not too much less). Below is the current diagram (as of July 3) for the neutral 161 call calendar spread. It includes a long October 161 call at $5.56, and a short August 161 call at $3.69, for a net debit of $1.87:
The diagram above shows that on the day of the expiration of the August short call, the spread would make a profit if SPY's price were anywhere between $155.54 and $166.93, a 10-1/2 point range. Maximum profit would be $221, which would occur only if SPY were exactly at the $161 strike on that day. Profit falls off fairly steeply both at lower and higher prices than $161. Maximum loss would be the $176 debit. Without any change in IV, this trade could work if we had identified a strong demand level above $155.54 and a strong supply level below $166.93, both of which we expected to hold until the August expiration.
Now let's see what effect an increase in volatility would have. To illustrate the effect dramatically, we'll use a large increase, say 50%, in implied volatility. This would increase volatility from about 16% to 24%. That level of IV was last seen seven months ago, and is not unheard of by any means.
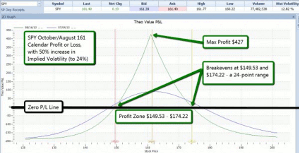
Below is a payoff diagram for this same spread, the only difference being that 50% increase in implied volatility:
NEXT PAGE: A Strategy for Ranging Underlying
|pagebreak|Notice that the maximum profit has almost doubled, from $221 to $427. This is because the long October option would now have had its time value inflated considerably by the increase in IV. That long option's time value at the short option's expiration is the key to profit on this trade.
So a neutral calendar can be a good play if you believe that price will stay in a range, and it's likely that implied volatility will increase. Its downside, however, is that its maximum profit is attained only at the exact strike price.
Is there any way we could get a neutral calendar to pay off a high proportion of its maximum profit over a wider range than just a single point? In fact there is-by doubling it up.
A single calendar whose strike is at the underlying's current strike price is price-neutral. As we saw last time, a single calendar at a higher strike price is a bullish trade. It also follows that a single calendar at a lower strike price is bearish, since the strike price is the point of maximum profit. How about doing one calendar that is slightly bearish, together with another calendar that is slightly bullish?
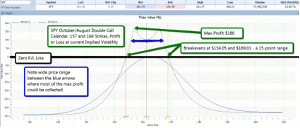
That is the idea behind a double calendar. An example is shown below, using the $157 and $166 strikes, each about 4-1/2 points away from the $161.40 current SPY price:
Notice these differences compared to the original single calendar diagram:
Costs roughly twice as much as the single calendar, with a debit of $343 compared to $187.
Max profit (assuming no volatility change) is a little less, at $186 compared to $221.
BUT-break-even price range is a much wider for the double, at $154.05 to $169.01 (15 points wide) compared to the 161 single calendar's range from $155.54 to 166.93 (10.5 points). This increases the probability of profit for the double calendar to 65%, compared to 53% for the single calendar. (These probability estimates come from the probability calculator built into TradeStation and other platforms, calculations not shown here).
AND-as shown by the blue horizontal arrows, there is a fairly wide price range within which a large fraction of the maximum profit can be made. This is in contrast to the single calendar, where maximum profit is made only with the underlying settling exactly at the strike, and falls off steeply on either side of it.
So a double calendar, like the neutral version of the single calendar, is a range-based trade. It has a wider break-even range, and therefore a larger probability of making a profit. Any profit it does make will be larger than the single calendar would, unless the price were to be very near the single calendar's strike.
Finally, we saw earlier that a single calendar would be greatly helped by an increase in implied volatility. Let's give the double the same treatment.
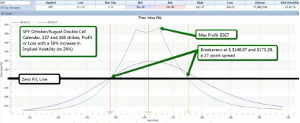
Below is a diagram of the same 157/166 August/October double calendar as above. The only difference is a 50% increase in IV, from 16% to 24%:
From this, we can see that the double calendar is helped even more than the single by an increase in implied volatility. Its maximum profit soars from $186 (at current volatility, earlier diagram) to $567, almost tripling. This is because it has two long October options, at the 157 and 166 strikes, which both will be inflated by the increase in IV. We realize the profit by selling these October options when the August options expire, thus cashing in the inflated time value in the Octobers.
So what's not to like about the double calendar? Not much, as long as the underlying price stays within the breakeven range. If it threatens to stray outside though, losses can accumulate quickly, so fast action is required. This is no surprise. We will have chosen our strikes so that our breakeven prices are farther away from the current price than the nearest quality supply zone and demand zone.
In summary, the neutral double calendar can be an attractive choice when the underlying is expected to remain in a range, and implied volatility is expected to increase.
By Russ Allen, Instructor, Online Trading Academy


