
Jared Woodard of CondorOptions.com offers potential trade ideas for some of the largest, most liquid ETFs.
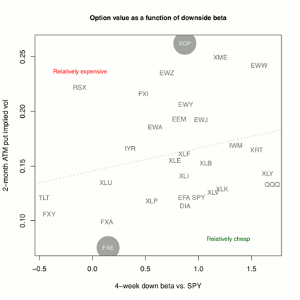
The chart below shows the relative attractiveness of major ETFs for hedging and speculative trades based on their market beta and implied volatility. Specifically, the chart shows the four-week downside beta of major ETFs against SPY along the x axis, with two month at-the-money put option implied volatility along the y axis. Down beta is calculated using only dates with negative market returns.
Click to Enlarge
Here’s how we use this information. High beta, low implied volatility ETFs offer cheaper hedge protection, since puts can be bought at lower cost while offering more responsiveness to market downside. Conversely, low beta, high IV ETFs are more attractive short volatility speculative candidates. The highest- and lowest-ranking assets are highlighted in large circles and are determined by the residuals from the linear regression shown on the chart.
Typically, the assets tracked here are related such that a linear regression is fairly intuitive and large deviations are easy to notice. Lately, however, the slope of the regression is flatter than usual. Developed market IV remains low even as the down betas spread out.
I think the marginal cost of put premium is worth paying here in order to get more downside beta from hedge positions, making tech (XLK) and consumer discretionary (XLY) sectors more attractive than broader large-cap hedges. We discussed this morning the several ways in which XLI premium is inexpensive as well. Speculators should be selling with an eye on curve rolldown more than on IV levels, although if emerging markets find some support, there’s more room for premiums to decline there.
By Jared Woodard of CondorOptions.com


