Over the crazy holiday season, soybeans fell sharply as the trend drastically and swiftly changed, notes Matt McKinney of Zaner Group, and here he offers some option plays for the current environment.
Fundamentally, HN15 or bird flu in China seemed to be the reason for the collapse in soybean futures on the Chicago Board of Trade over the last several trading days. This may not go away anytime soon, in fact according to Hightower Reports, "The Chinese Ministry of Agriculture announced Thursday (1/2/14) that the southwest province of Guizhou has reported an outbreak of H5N1 in poultry. This situation continues to "not" go away and could have longer term ramifications in their local meal and/or corn demand." So the story goes fundamentally, when it comes to demand all eyes should be on China I believe.
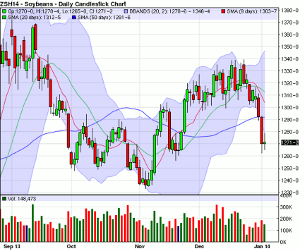
Technically, I have placed several indicators on this daily January soybean chart. They are the 9-, 20-, and 50-day simple moving averages (SMA'S), the Bollinger bands (BB's, light blue shaded area), volume, and candlesticks. The first item that I notice from placing these indicators on the chart is the cross of the 9-day SMA (red line) under the 20-day SMA (green line) back on about December 31 as both the 9-day and the 20-day point downward on very sharp angles on the daily chart below. This to me, is what I have coined a "super-trend" down. This change in trend happened very quickly and with lower than normal volume over the abbreviated holiday trading season. I expect this trend to continue.
I also noticed after applying my favorite technical indicators to this daily January soybean futures chart that this market is somewhat oversold for the following reasons:
1. The market is below the bottom line of the BB'S (Bollinger bands, light blue shaded area), which I consider the last area of support.
2. The market is also trading well below the 9-day SMA (red line) which is now the first area of resistance in my view. The market is also well below the 20-day SMA (green line), which is now the second area of resistance. Typically, the market could move back up to these areas and hold, only to go on and make new lows, if they are real resistance.
3. Finally, the market is trading well below the longer-term 50-day SMA (blue line), which could also be considered the first area of resistance.
However, I am of the belief that markets can remain oversold for long periods of time, particularly if the market has strong downside technical momentum. This is just my technical opinion based on my favorite trend identifying indicators on the daily chart below. Nothing works 100% of the time, but I like the trend to remain down for the foreseeable future.
Daily January Soybean Chart
Options Play
Since, I am now bearish on this market, there could be several ways to play this market with options and one could be to buy straight put options or bear put spreads in a 3 to 1 ratio with a call for a hedge or "insurance" in case the trend changes on a dime and the market rallies. Another potential play could be to sell naked options or option spreads, again with protection maybe in the form of a futures contract or with other option plays. Remember, when you sell naked options, you have unlimited risk and should have a "well funded" account of risk capital.
By Matt McKinney of Zaner Group


