Matt McKinney of Zaner Group details how and why trading options in markets like the indices can be a great way to go, especially given the current economic environment and since the E-mini S&P 500 (ES), E-mini NASDAQ-100 (NQ), and E-mini Dow (YM) are all trending.
When indices like the ES, YM, and the NQ are trending and indicators are lining up, options can be a terrific way to go.
Strategy wise, believe it or not, trading put options in markets like the indices can be a great way to go in this economic environment. Put options can be used as these markets are selling off either as a solid play as a standalone trade or as a hedge for existing stock portfolios. In terms of a speculative trade, just buying outright put options with roughly 45-90 days until expiration has been a great way to go for a select few clients. For traders and investors who are currently long the stock market, buying put options to hedge a portfolio is also advisable. Because, in my view, this is much easier than trying to trade the actual stocks and getting in and out trying to time the market. I think buying put options on the ES, YM, and/or the NQ can be a proactive way to try to take advantage of this falling stock market. It seems like a better idea than just holding on until the market comes back. This type of trade is one that I have several years of experience in.
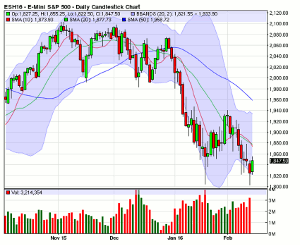
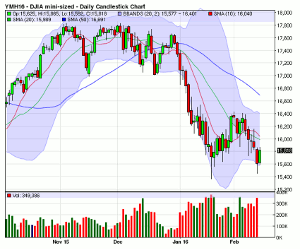
Technically, I have added my favorite technical indicators to the charts below. I have coined them the "10/20/50/BB Trend Finder." They are the 10- (red line), 20- (green line), and the 50- (blue line) day Simple Moving Averages or SMAs. I have also added Bollinger Bands or BBs (light blue shaded area) and Candlesticks (the red and green bars with the candlestick wicks and on this daily chart each bar represents one day of trading). These few technical indicators can tell me many, many different characteristics about the market at a quick glance so I have them saved on my charts in MARKETHEAD, so they can populate on any chart I choose at the click of a mouse.
These indicators on the daily charts below tell me that the market is in a principal trend down. This occurs when the 10-day SMA (red line) crosses down and under the 20-day SMA (green line) and the market trades below the 10-day SMA. A principal trend down is the strongest form of a downward trend that my "10/20/50/BB Trend-Finder" can show me.
To see the last chart and read the entire article, click here…
Trading commodity futures and options involves substantial risk of loss and may not be suitable for all investors. You should carefully consider whether trading is suitable for you in light of your circumstances, knowledge and financial resources.
By Matt McKinney of Zaner Group


