
“Our asset allocation model can help you refine when to re-allocate assets from U.S. equities to emerging markets,” writes Marvin Appel.
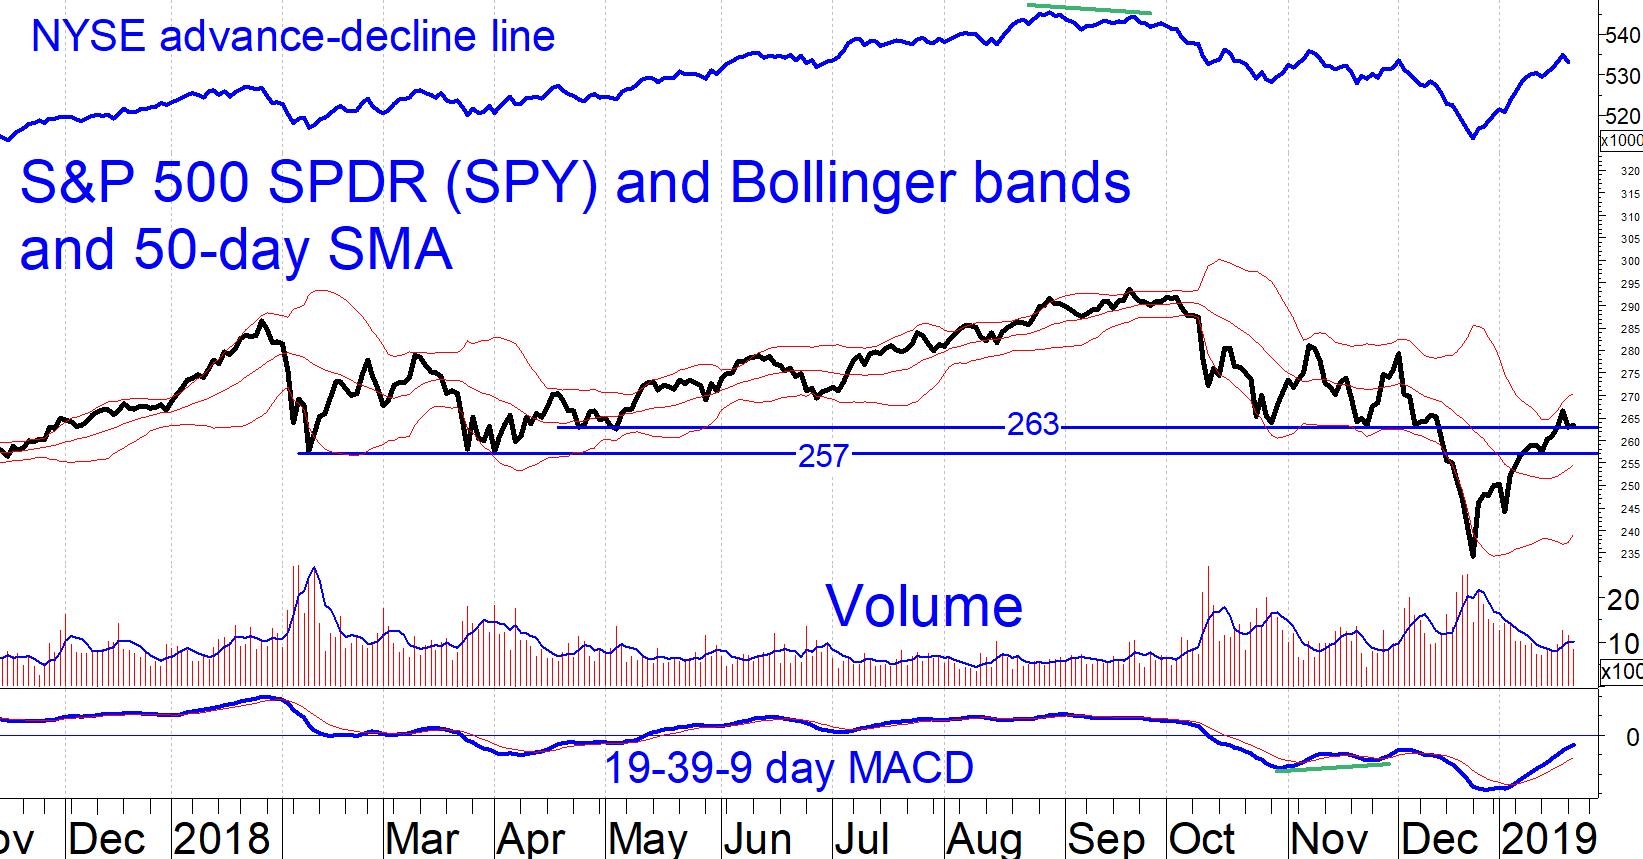
Stocks have rallied strongly off of their Dec. 24 lows and are now overbought after four consecutive weeks of gains. Most of our intermediate-term indicators are showing buy signals. These are trend-following indicators designed to give intermediate-term trades (weeks to months of holding). Nonetheless, it would be well within historical precedent for stocks to pull back to retrace some of the nearly 14% that the S&P 500 SPDR (SPY) gained between Dec. 24 and Jan. 18.
There is potential support for SPY between 254 (middle Bollinger band) and 263, a strong support level that was tested and held up several times in 2018 prior to the December plunge (See chart below).
The longer-term outlook from our major reversal indicator is that 2019 will be profitable. However, given that analysts expect modest earnings growth of under 10% in 2019, and considering that stocks are relatively expensive by historical standards, it does not seem likely that 2019 will be a year of major gains. Indeed, a large fraction of potential gains this year may already have occurred in January. Although profits are likely to accrue to investors who stick it out this year, it seems that volatility will be high relative to the strength of any coming uptrend, much as was the case in 2018 from mid-January to the start of the fourth quarter.
Opportunity in emerging markets
Renowned bond manager Jeffrey Gundlach opined in Barron’s this week that emerging markets would be a relative bright spot in the stock market in 2019. Our asset allocation model can help you refine when to re-allocate assets from U.S. equities to emerging markets.
The iShares Emerging Markets Index exchange traded fund (EEM) did not make a new low on Christmas Eve, holding up better than U.S. and other developed-country ETFs (see chart). Unlike other broad-based ETFs, the MACD of EEM formed a bullish double rising bottom. However, we saw the same bullish formation in the July-August timeframe, without a subsequent rally.
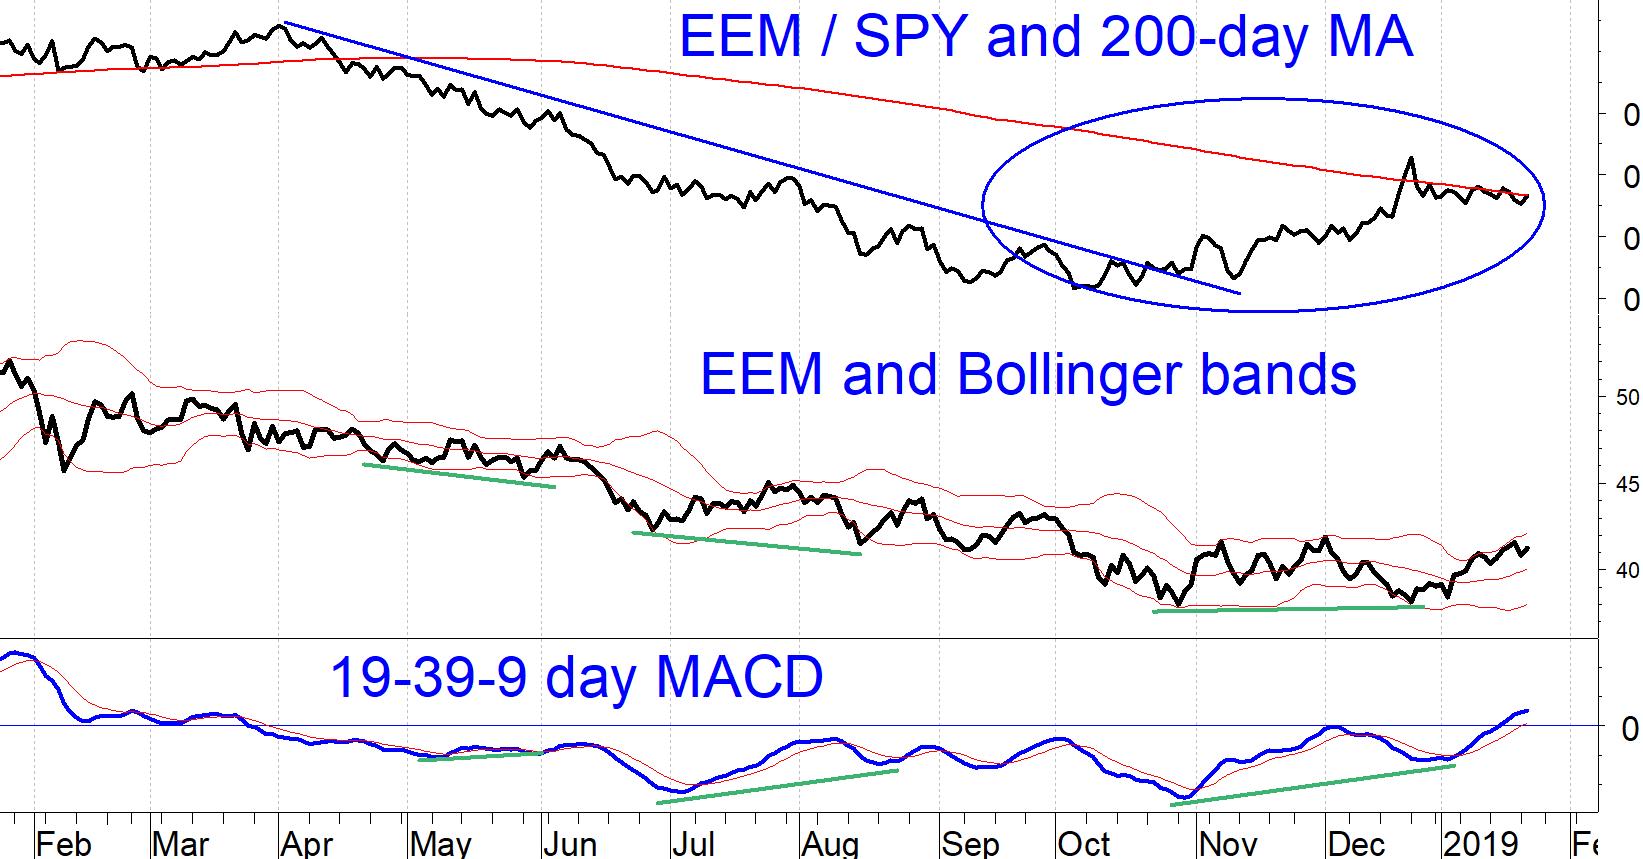
The longer-term bull case arises from the EEM/SPY ratio. The circled area in the chart shows that EEM has been outperforming SPY since early October, evidenced by the EEM/SPY ratio rising. When this ratio has been above its 10-month simple moving average, EEM has outperformed SPY. The EEM/SPY ratio is close to its 200-day moving average, which means that it is close to crossing from below to above its 10-month average for the first time since April 30, 2018.
It doesn’t look like we will get the signal to re-allocate from SPY to EEM on Jan. 31, 2019; that would require EEM to outperform SPY by 1.9% between now and the end of January. However, this is a potentially attractive trade to watch in 2019. Update the ratio EEM/SPY (using total return) and the 10-month simple moving average of EEM/SPY at the end of each month. When the ratio gets above its 10-month average, add EEM (or VWO, the Vanguard ETF with the same objective) to your equity portfolio.
This asset allocation method always keeps you invested; you will have to use separate indicators to determine if your best move is to be completely out of the market; or you could lower your overall market exposure by executing this as a pairs trade.


