
Al Brooks provides a technical outlook on crude oil and the EURUSD currency pair.
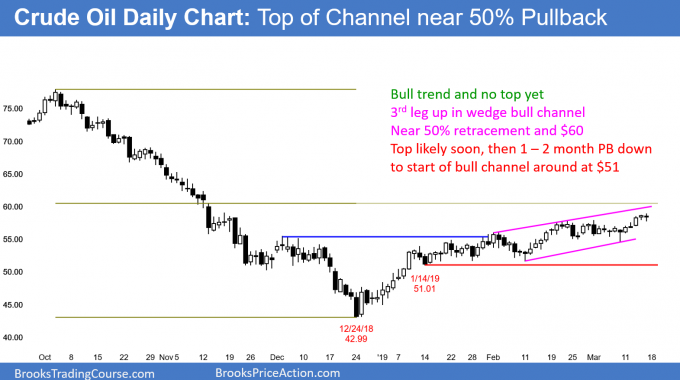
The crude oil futures contract is getting close to a 50% retracement of the bear trend. It will probably get there within a couple weeks. That is also at the top of the bull channel and around the $60 level (see chart below). Once there, it will then probably trade down to around $51 over the following two months.
There is only a 25% chance of a successful bull breakout above a bull channel. With the other resistance slightly higher, the rally will probably stall soon.
Because the bull channel is tight, the first reversal down will likely be minor. However, a bull channel with three or more legs, functions as a wedge, which is a buy climax. A reversal from a buy climax typically has at least to legs sideways to down. In addition, it usually has about half as many bars as there were in the bull channel. Finally, traders should expect a test of the start of the channel. That is the Jan. 14 low of $51.01.
There is no top yet and room to the targets above. Therefore, the chart rally will probably go above $60 before the bulls will take profits and the bears will begin to sell. The reversal will probably begin within three weeks. The selloff will probably be sideways to down for a month or two. Traders expect it to end around $51. At that point, the bulls will buy, and the bears will take profits. The bull channel will then have transitioned into a trading range.
Euro Technicals
The EURUSD Forex market is awaiting a Brexit resolution. While it is in a bear channel, the channel is basically a four-month tight trading range. Traders will continue to bet on reversals every two to three weeks (see chart).
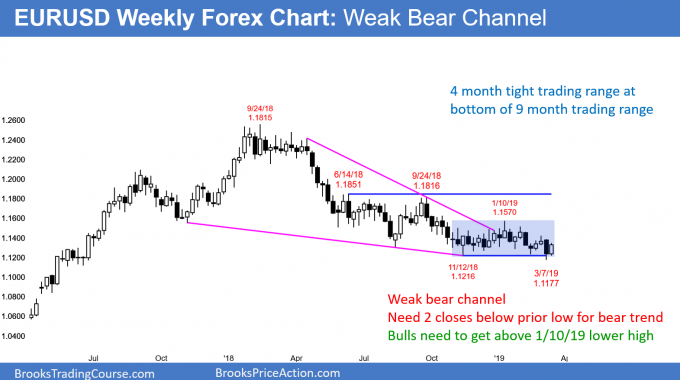
The EURUSD weekly Forex chart has been in a weak bear channel for nine months. The past four months have been essentially in a tight trading range. There have been many minor breakouts up and down, but the chart continues to reverse every two to three weeks. There is no technical reason to expect a strong breakout up or down.
This mostly sideways trading is due to the uncertainty over Brexit. Consequently, at some point there will be clarity. Once there is, the chart will again trend, but no one knows the direction. When a market is in a tight range, traders should assume that the probability of a bull breakout is the same as for a bear breakout. Additionally, they must understand that there is a 50% chance that the first breakout, up or down, will fail and reverse.
Until there is a breakout, there is no breakout. Traders will continue to look for reversals every two to three weeks.
Trading Room
Traders can see the end of the day bar-by-bar price action report by signing up for free at BrooksPriceAction.com. I talk about the detailed E-mini price action real-time throughout the day in the BrooksPriceAction.com trading room.


