
A two-month pullback in the S&P is more likely than a continued rally, says Al Brooks.
The E-mini S&P 500 has a parabolic wedge buy climax at the 2825 resistance level accompanied by a loss of momentum. What this means is that the S&Ps are more likely to retreat than make new highs.
In March, the monthly S&P 500 E-mini futures chart had a high above the February high and a low above the February low (see chart below). Another bullish factor was a bull body, but the bull body was small enough to make the candlestick qualify as a doji bar. That is a sign of a balanced market.
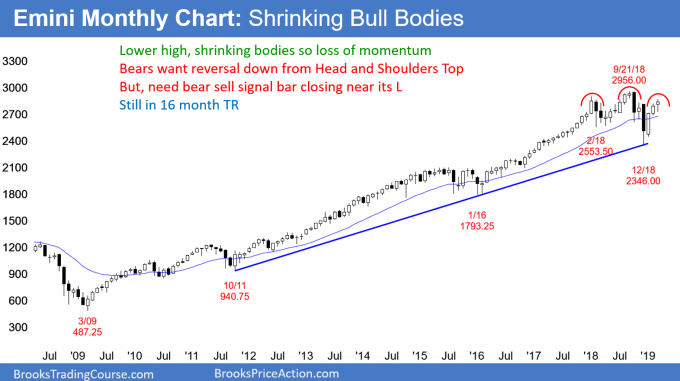
This small bull body followed a medium size bull body in February and a big bull body in January. Shrinking bodies represent a reduction in momentum. As a bull trend loses momentum, it begins to pull back. At some point, a bar trades below the low of the prior bar.
With March being close to neutral, the bull trend could pause more. April might be sideways. If so, its high could be around the March high and its low could test the March low. This is important because the March low is about 100 points below the March close. Therefore, there is an increased chance of a 100-point selloff in April.
Long-term Range
With so many stocks up 20% or more this year, it is easy to forget that the stock market is still in a 16-month trading range. Trading ranges typically have pullbacks every few bars. Therefore, the E-mini will probably either trade below the March low in April or the April low in May.
That does not mean that the selloff will be the start of a reversal down from a head and shoulders top. However, it would remind traders that the market is still in a trading range.
Trading ranges regularly disappoint bulls and bears. There are many strong legs up and down. Trend traders are always hoping that one will lead to a trend. But, when a market is sideways, reversals are more common than breakouts. Consequently, the E-mini will likely disappoint the bulls within a month or two.
Pullback Coming Soon
Over the past 100 years, less than 20% of bull trends failed to have at least one monthly pullback in a bull year. Traders should assume that there will be at least one sideways to down pullback this year that lasts two or more months.
With the buy climaxes on the daily and weekly charts, the 2825 resistance, and the loss of momentum on the monthly chart, April or May are good candidates for the start of a pullback. May has historically been a weak month for stocks, i.e. sell in May and go away.
A pullback can grow into a bear trend. But this rally has been unusually strong. In addition, it began as a reversal up from an extreme sell climax at the monthly bull trend line. This combination makes a second leg up likely. Consequently, even if the selloff lasts more than two months and retraces more than half of the three-month rally, bulls will look to buy a reversal up.
At the moment, traders should begin to expect a pullback lasting at least a couple months. It might simply be a sideways pause, but it could be deeper and faster than what is currently likely.
Will there be a new all-time high?
The three-month momentum up is strong. But, since the chart is in a trading range, there is only a 40% chance that this rally will make a new all-time high without at least a two-month pullback.
Furthermore, if it did, the buy climaxes on the daily and weekly charts would be even more extreme. That would increase the chance of a deeper and longer pullback.
Without a pullback within the next few months, there will probably be sellers at a new high. The bulls will have huge profits and a stop that is far below. They will therefore take profits. In addition, the bears will begin to sell, betting that the bulls will take profits.
A reversal down from a new high would create an expanding triangle top, which is a type of higher high major trend reversal. It would probably lead to a selloff lasting several months.
Failed Breakout?
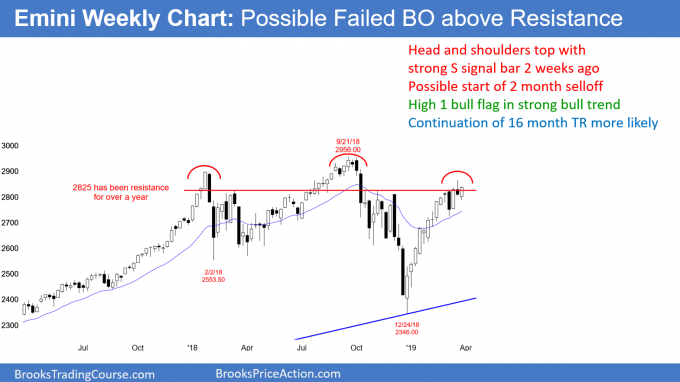
The weekly E-mini S&P 500 futures chart triggered a sell signal last week by trading below the previous week’s low (see chart below). Last week was the second sell signal bar in the past four weeks. By closing near its low, it was a strong sell signal bar.
However, last week was the entry bar and it had a bull body. That reduces the chances of a sharp selloff. Instead, it increases the probability of the E-mini going sideways for a couple weeks. Because the week closed near its high, it is a buy signal bar for next week. However, it is still on last week’s sell signal, and several other factors that I am discussing this week weaken the bull case.
Exhausted bulls
Because last week was a pullback and it had a bull body, it is a High 1 bull flag buy signal bar for next week. But there is a problem. Once a bull micro channel has five or more bars, the odds are that traders will buy the first pullback.
Also, when the micro channel lasts about 10 bars, it is extreme. The bulls get exhausted. That is a problem for traders wanting quick, significantly higher prices.
Consequently, the rally from the first pullback typically struggles once it gets above the top of the micro channel. Traders expect a deeper, longer pullback to begin after a few bars up. As a guide, I look for about 10 bars and two legs sideways to down. That is about two months.
That is the case on the weekly chart. The bear reversal bar from two weeks ago is a good candidate for the high for the next couple of months
Parabolic Buy Climax
The daily E-mini S&P 500 futures chart has an interesting chart pattern. The March 21 huge bull bar was a one day buy climax (see chart below). It followed an eight-bar bull micro channel, which is a bigger buy climax.
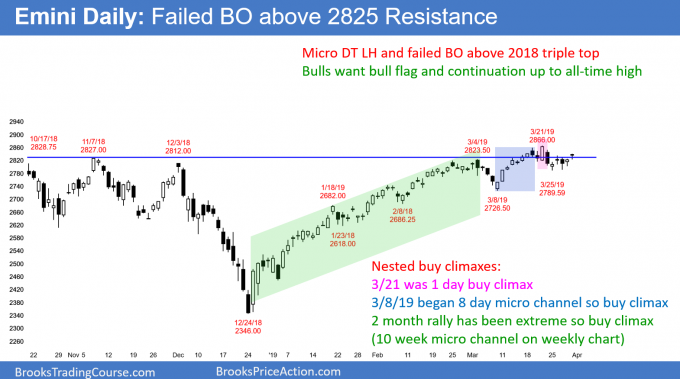
The weekly chart has a 10-bar bull micro channel from the December low. That is an even bigger buy climax.
There are now three consecutive buy climaxes. Each is shorter in duration. This is a sequential buy climax pattern with the climaxes coming faster.
Think of it as a variation of a parabolic wedge buy climax. A parabolic wedge rally is a tight bull channel with at least three legs. The daily chart is in a tight bull channel, and it has three buy climaxes. The climaxes are shrinking in duration, much as the legs in a wedge shrink.
As for a more traditional parabolic wedge, the daily chart only has two clear legs up. The tops are the March 4 and March 21 highs. If the E-mini makes a new high within the next couple of weeks and reverses, the daily chart would then have a clear parabolic wedge top. This is in addition to the sequential buy climaxes that currently exist.
What should traders expect?
There is already a credible top on the weekly chart. The daily chart has sequential buy climaxes. Also, it might have formed a micro double top and a lower high this week. The rally is stalling at 2825, where it has failed many times over the past 16 months.
Based on the weekly chart, a two-month pullback has either begun or it will begin within a few weeks. The daily chart might also get a new high to create a more traditional parabolic wedge top.
These factors make it likely that either the high from two weeks ago is the start of a two-month selloff, or there will be one more brief new high before the selloff begins.
Can the rally continue up to a new all-time high without a two-month pullback? Of course, it can, and if it does, no one will be surprised. The three-month rally is very strong, and it came from a climactic reversal up from a monthly bull trend line.
However, remember that the E-mini has been sideways for 16 months. My 80% rule says that 80% of strong legs in a trading range reverse. Also, the monthly chart is losing momentum as it tests the 2825 resistance. Therefore, there is better than a 50% chance of a two-month pullback before there is a new all-time high.
Will the bulls get a new high this year? The 10-year bull trend has been incredibly strong. My 80% rule on inertia also applies to trends. Eighty percent of trend reversal attempts fail. Traders should therefore assume that there will be a new all-time high in the second half of the year.
But, a trading range late in a bull trend is usually the Final Bull Flag. Therefore, the 2018 trading range will probably be the Final Bull Flag in the 10-year range. That means that there will probably be a major trend reversal down to around 2,000 that starts within one to 10 months after making a new all-time high.
Trading Room
Traders can see the end of the day bar-by-bar price action report by signing up for free at BrooksPriceAction.com. I talk about the detailed E-mini price action real-time throughout the day in the BrooksPriceAction.com trading room. We offer a two-day free trial.


