
The latest QuantCycles Oscillator provides two strong signals, says John Rawlins.
While nearly every major stock, particularly in the Dow Jones Industrial Average Index, took a hit on Monday, the QuantCycles Oscillator has interesting plays in both directions.
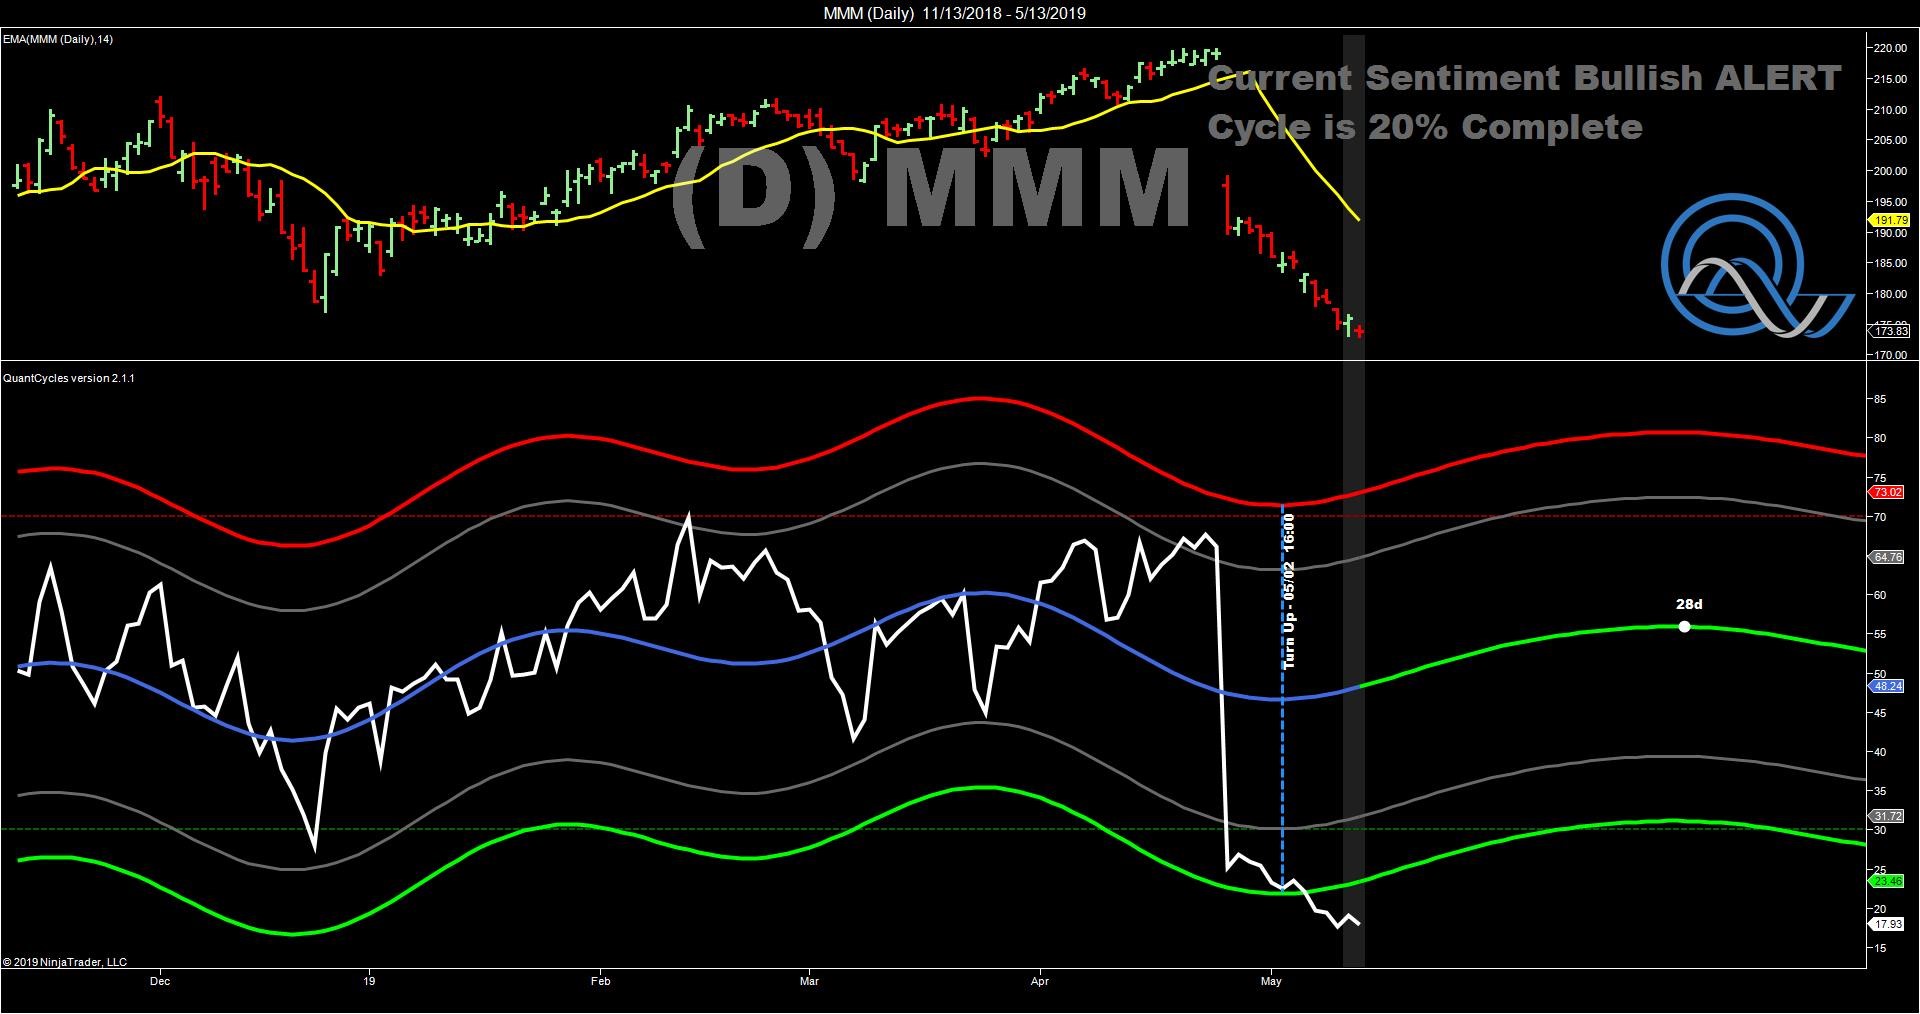
3M (MMM) took a major hit last month following a poor earnings number and has continued to lose ground. The daily oscillator turned at the beginning of May but the stock continued to lose ground pushing it into deep oversold territory (see chart).
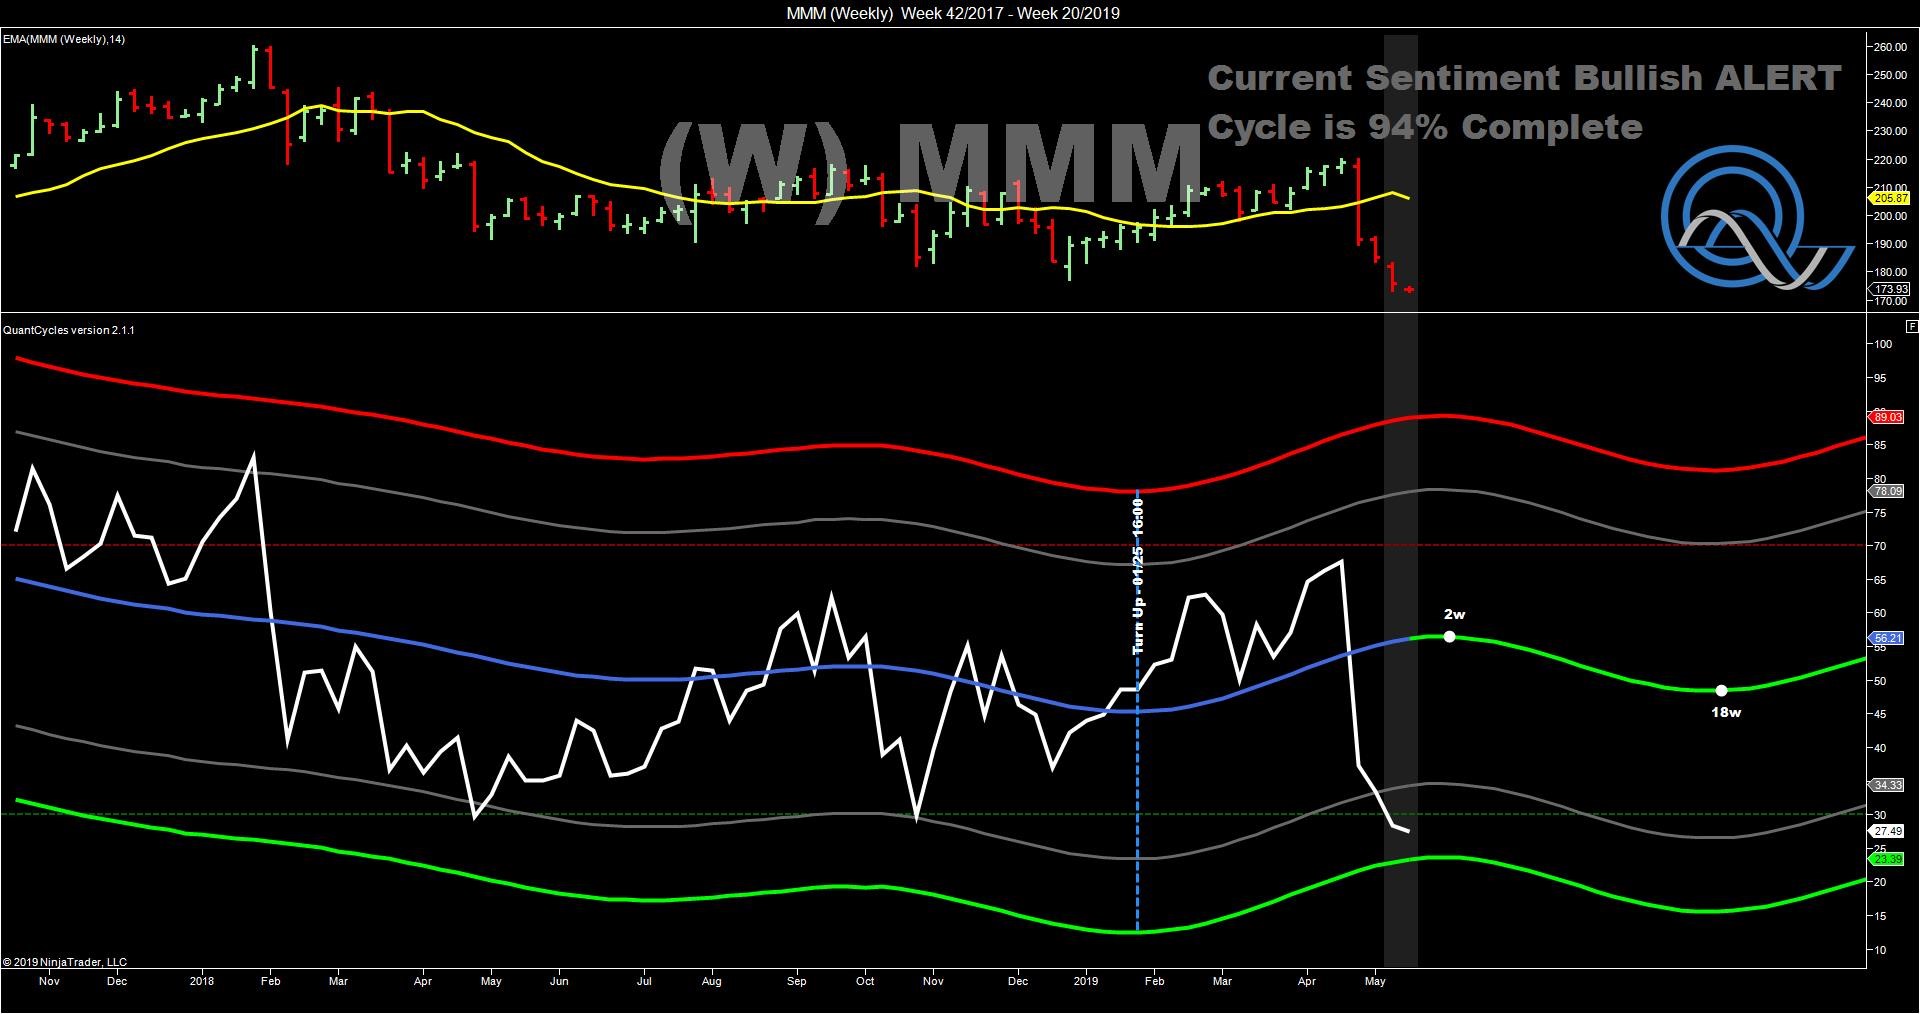
3M actually outperformed the Dow on Monday, dropping only 1.02% vs. 2.38% for the index. It is having a poor year and the sharp April sell-off occurred in an up cycle. That long-term cycle is expected to persist for a couple of more weeks, and 3M is near extreme oversold territory in the weekly (see chart).
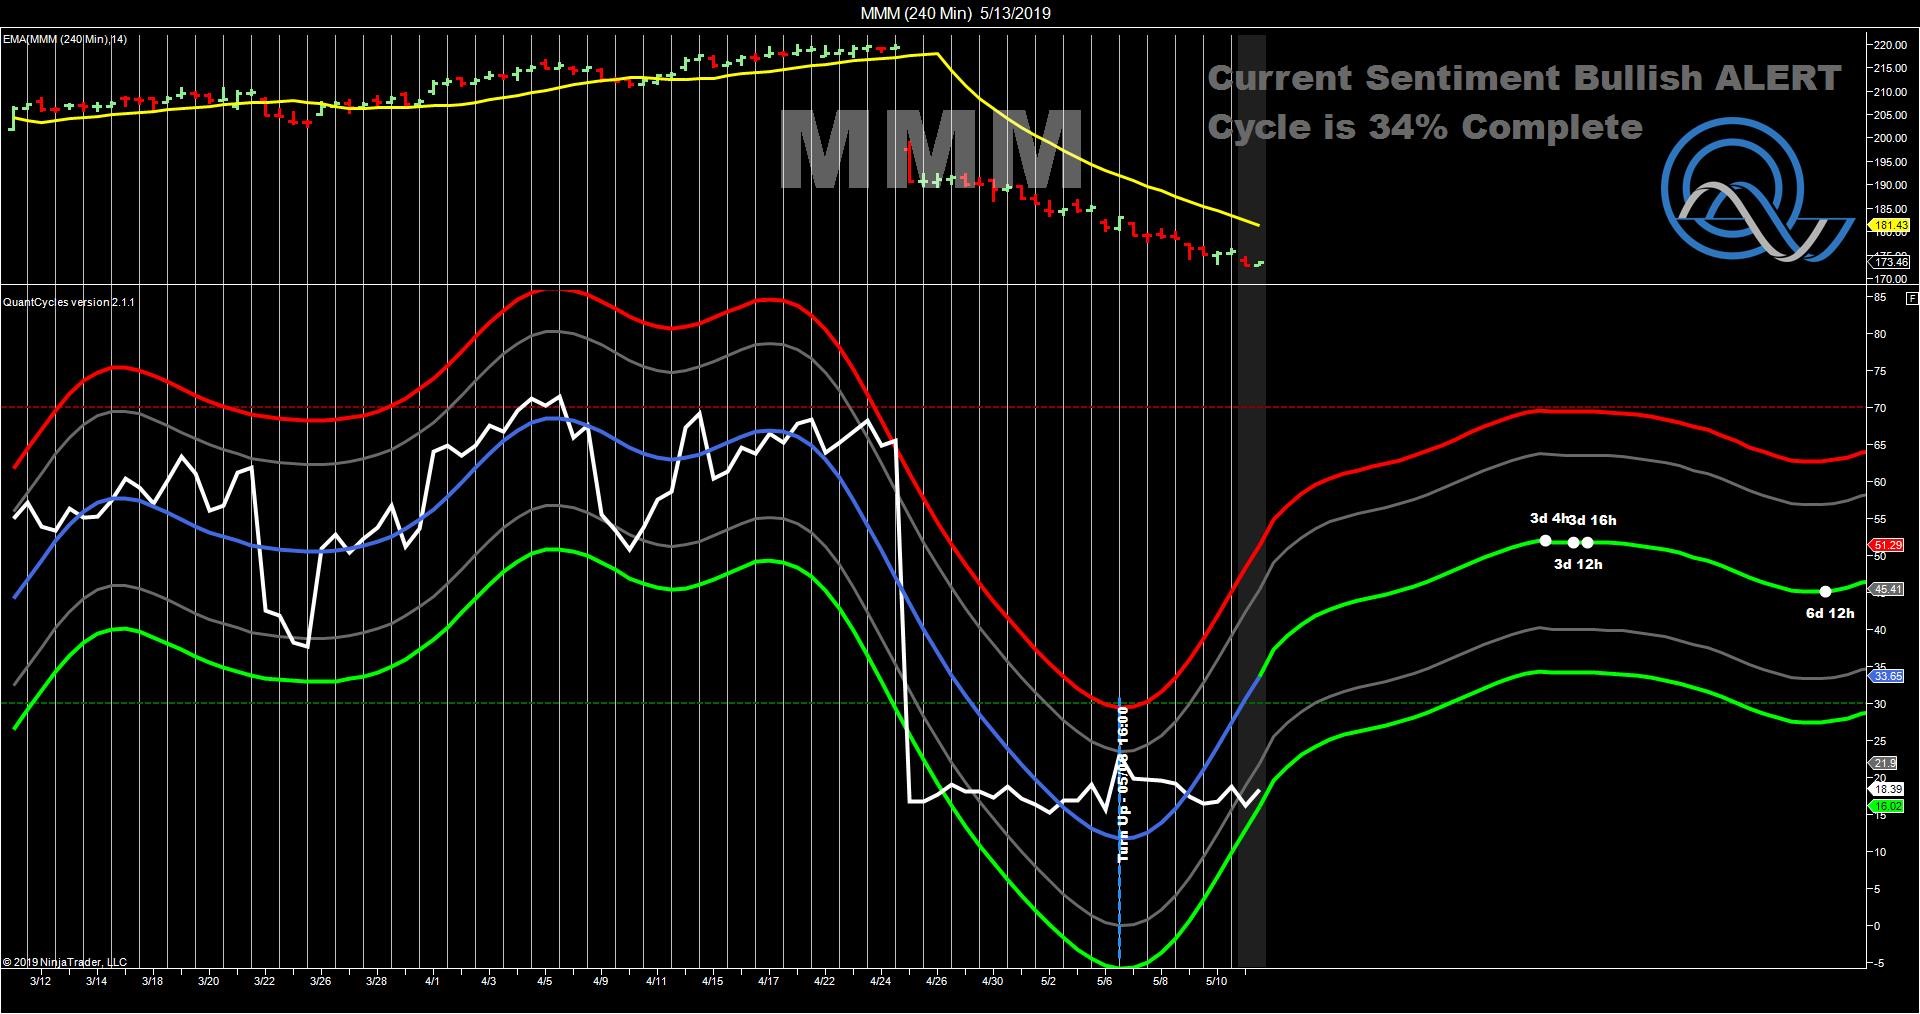
The short-term (four-hour) oscillator turned up last week and the stock’s recent weakness has put it in oversold territory, creating a solid confirmation of a long play.
Tyson Foods
Given that recent U.S.-China trade tensions has put pressure on the agriculture sector, it is a good time to find a stock with poor technicals to match the weak fundamental perspective in the sector.
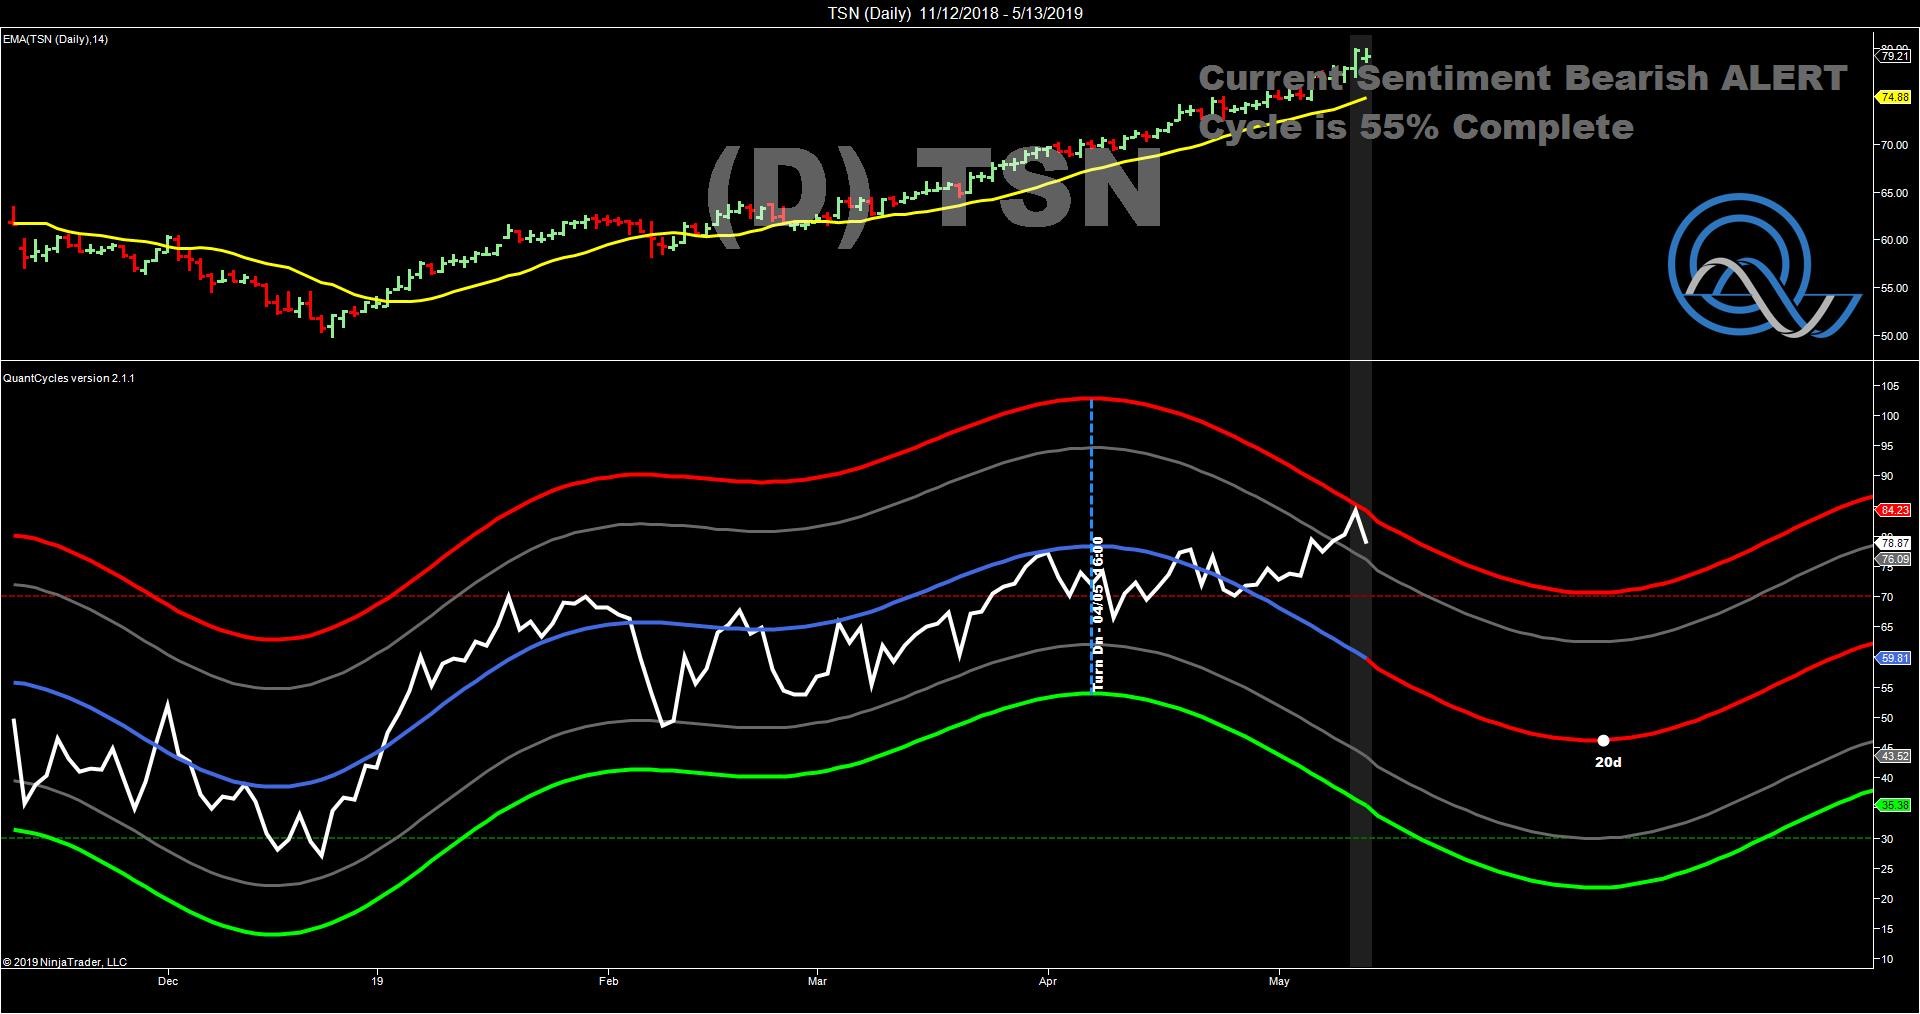
Tyson Foods (TSN) has been on a tear since the December 2018 market bottom. The long-term QuantCycles Oscillator turned in the middle of April, but the stock continued to rise, putting it near overbought condition (see chart).
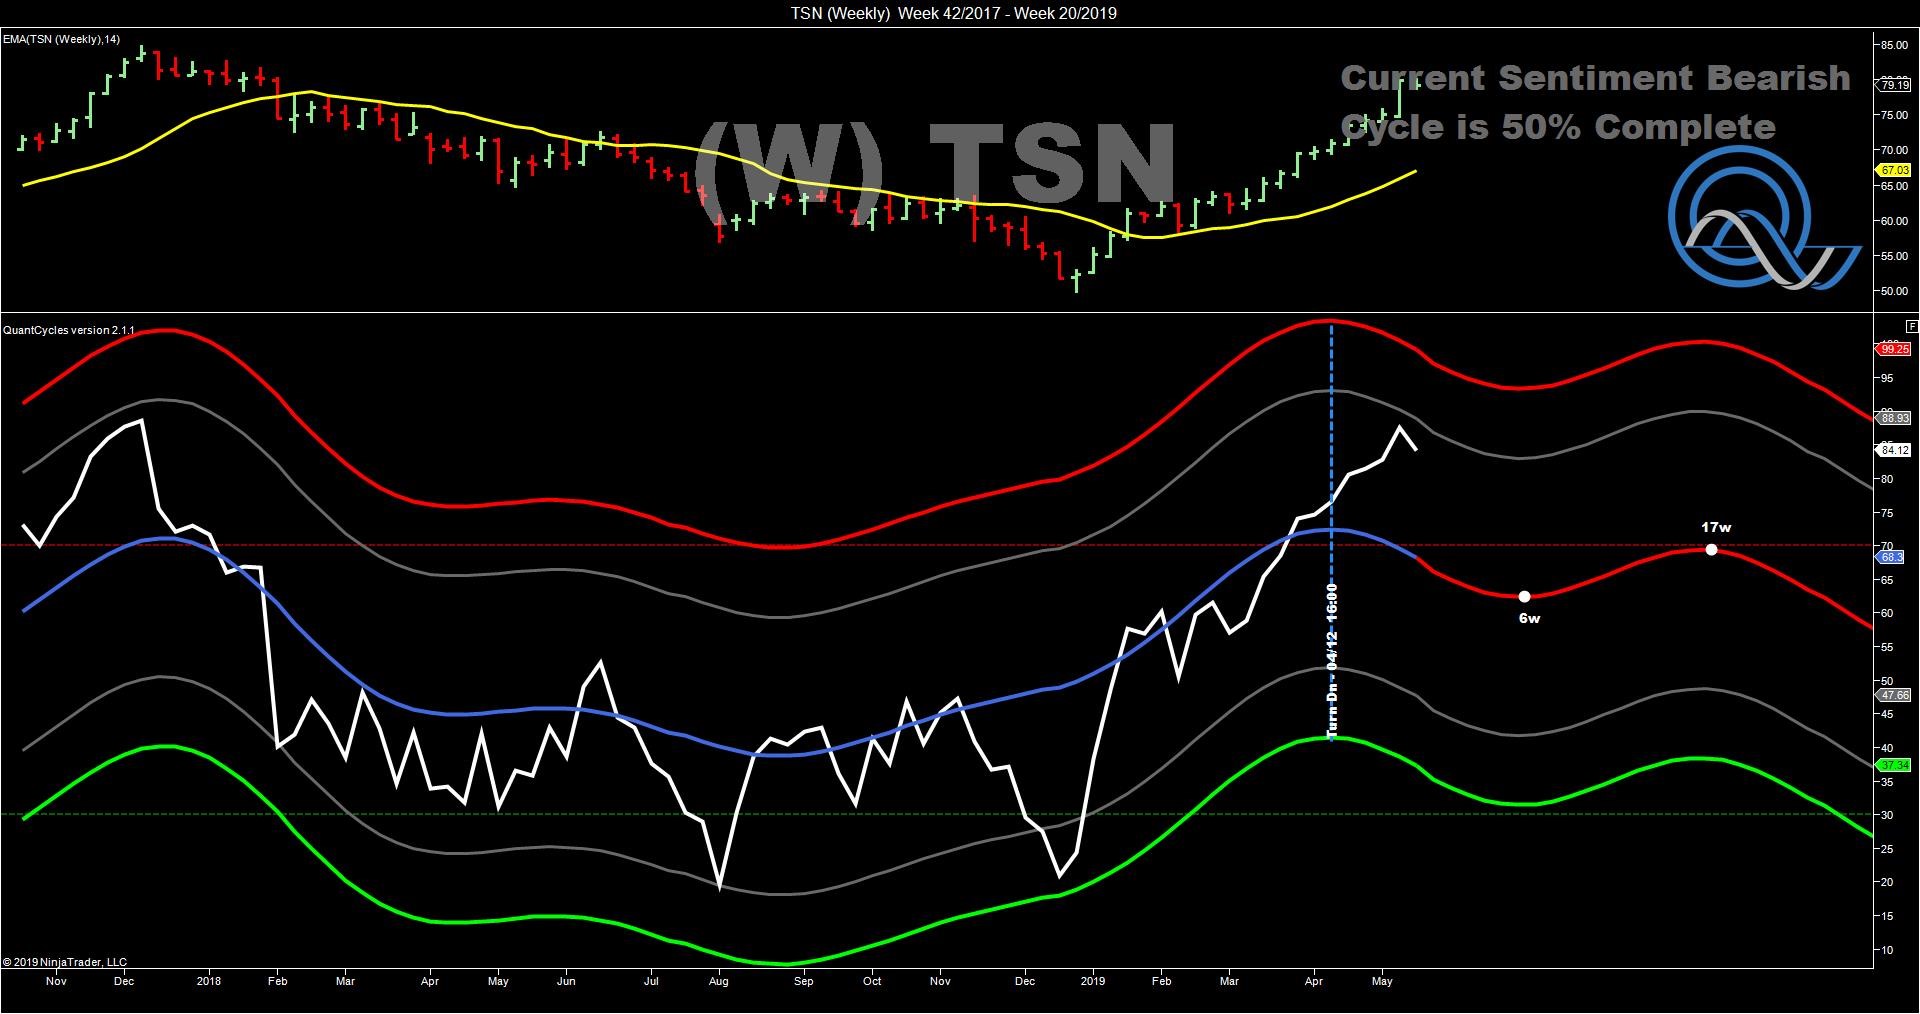
The weekly chart expects continued weakness through June.
The daily chart turned at the same time. It has touched on extreme overbought territory going into yesterday’s sell-off. It expects to move lower over the following month.
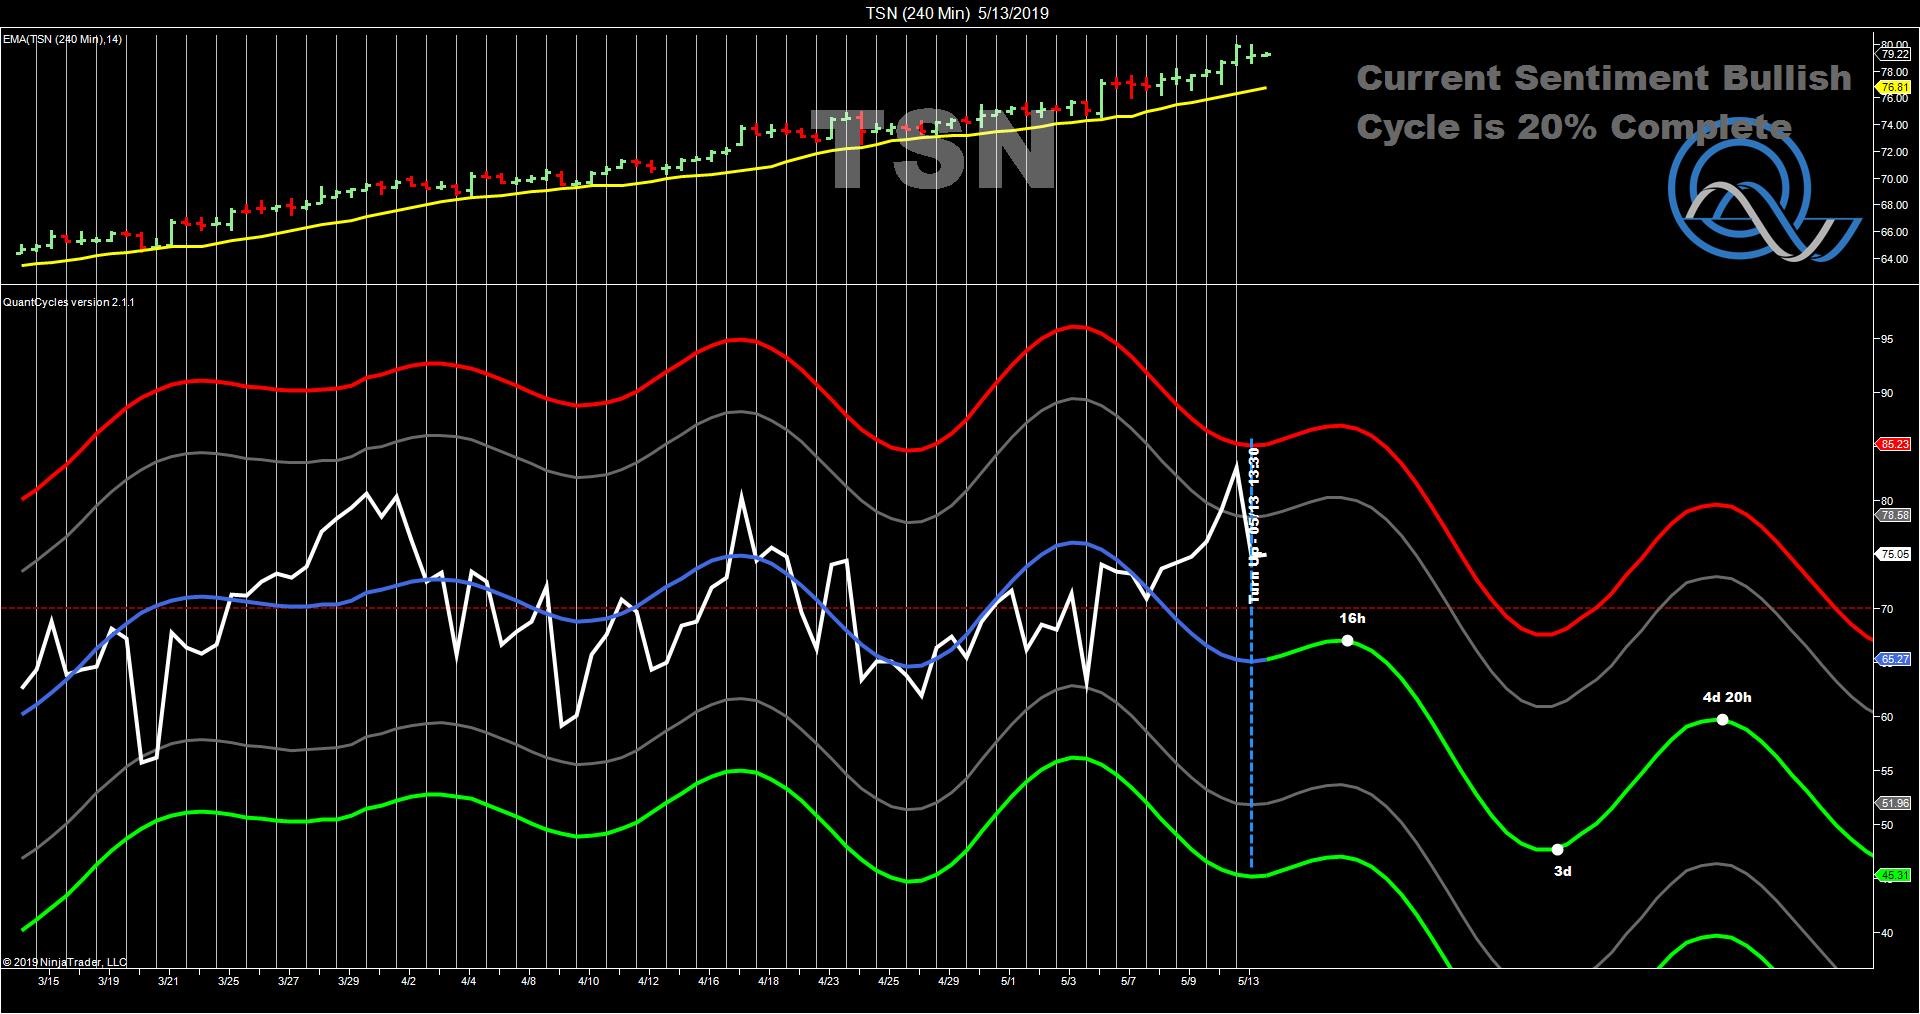
The short-term oscillator confirms the bias creating a strong short signal.
John Rawlins described the value of the QuantCycles Oscillator recently at The Orlando MoneyShow.
The QuantCycles indicator is a technical tool that employs proprietary statistical techniques and complex algorithms to filter multiple cycles from historical data, combines them to obtain cyclical information from price data and then gives a graphical representation of their predictive behavior (center line forecast). Other proprietary frequency techniques are then employed to obtain the cycles embedded in the prices. The upper and lower bands of the oscillator represent a two-standard deviation move from the predictive price band and are indicative of extreme overbought/oversold conditions.


