
The QuantCycles Oscillator shows the 10-year T-note as extremely overbought and expects it to drop sharply, notes John Rawlins.
With the entire trading world watching what Federal Reserve’s Open Markets Committee (FOMC) would do with the short-term Fed funds rate, it is a good time to look at longer-term rates.
The 10-year Treasury note and long bond have been in the midst of a sharp rally since mid-April. Many analysts suggested the bond rally was pushing a rate cut (higher bond and note prices translates to lower interest rates).
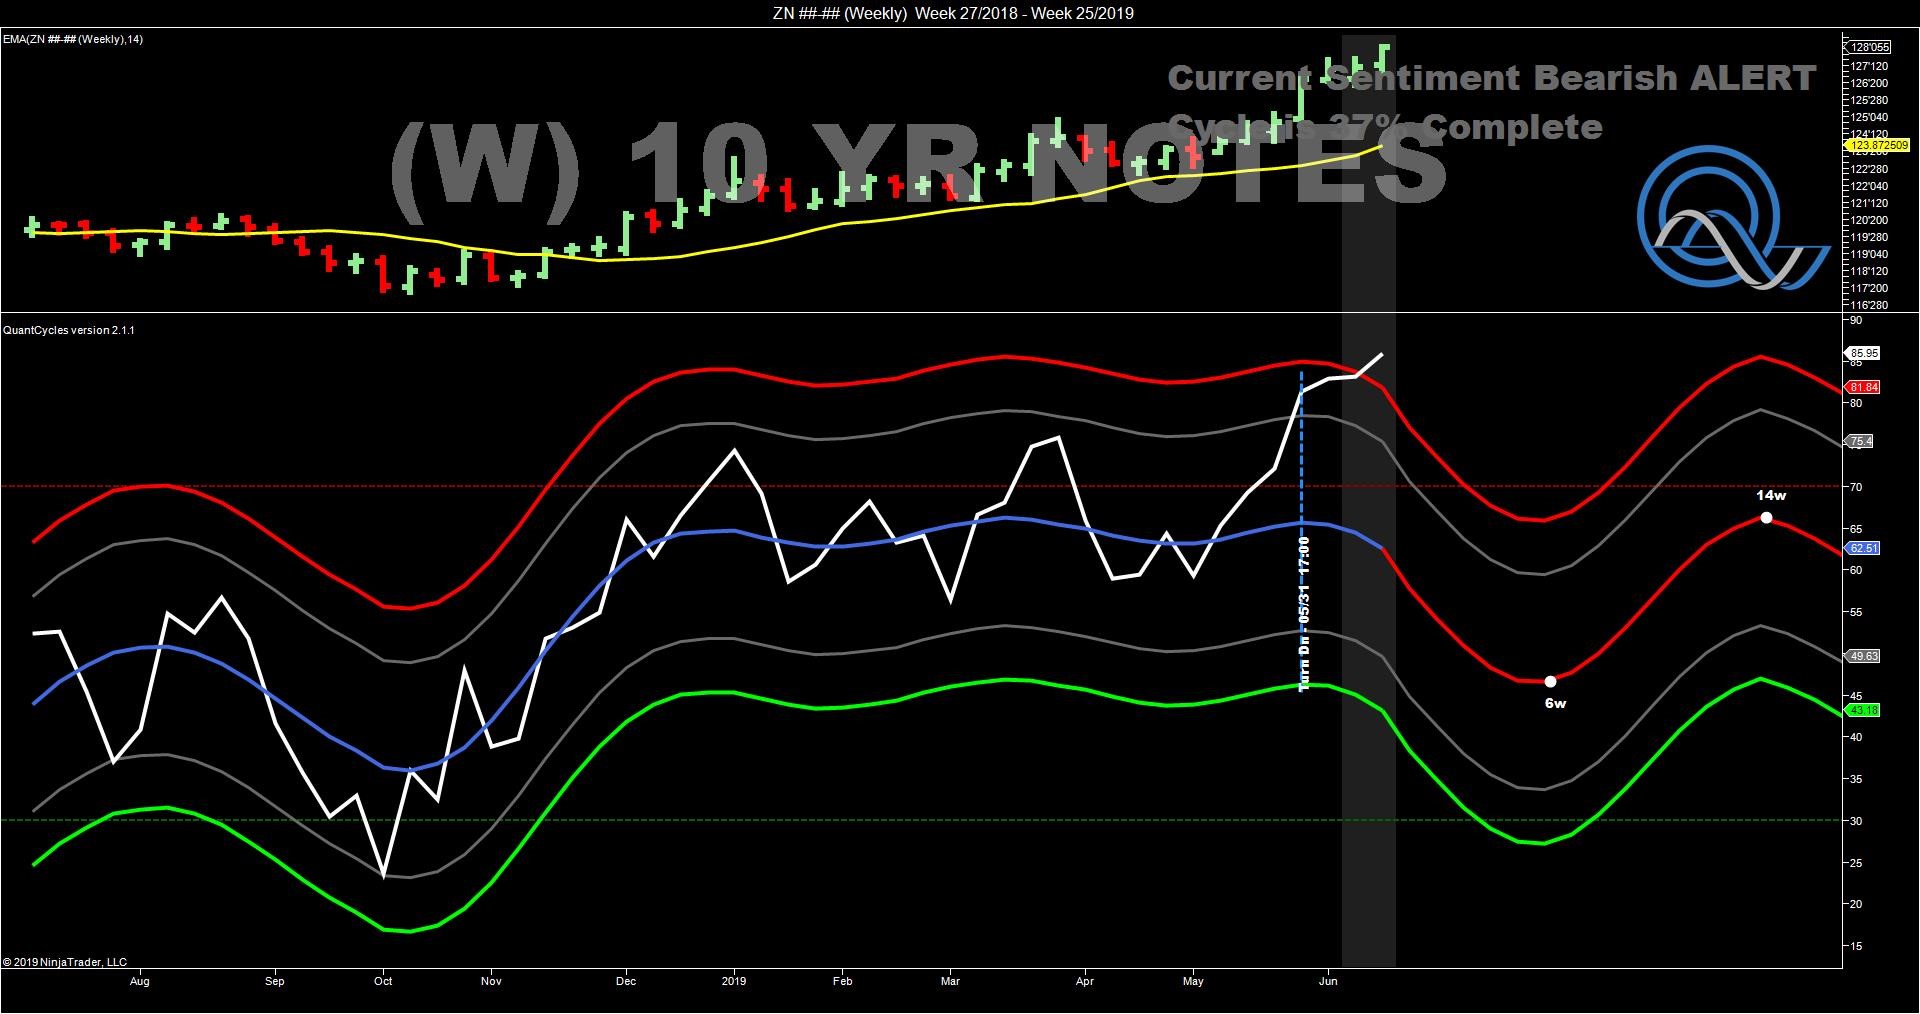
The QuantCycles Oscillator appeared to signal a top in the 10-year T-note at the end of May. Despite this, T-notes continued to rally as the street priced in a higher likelihood of a rate cut.
This pushed the QuantCycles long-term oscillator into overbought territory (see chart). The weekly chart is not only extremely overbought, but is also signaling a sharp decline that is expected to last for six weeks.
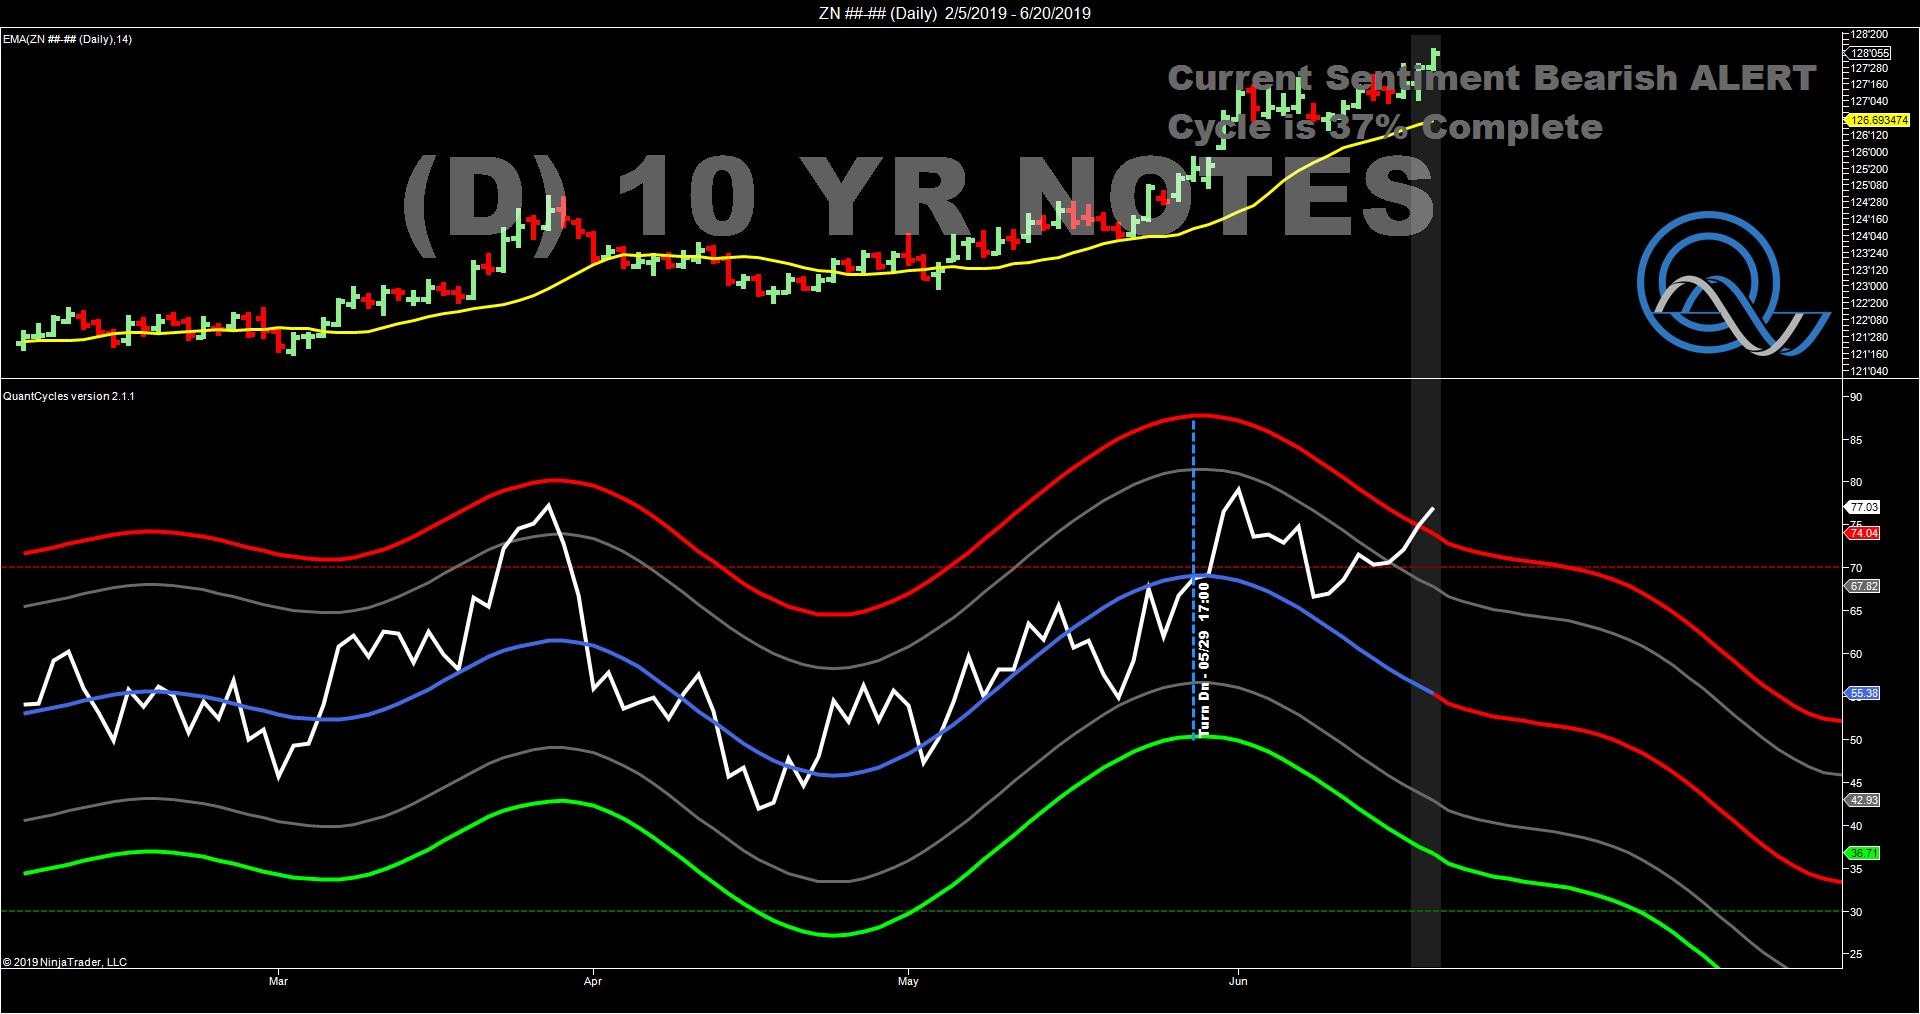
This sell signal is confirmed by the daily oscillator. The daily QuantCycles is extremely overbought and is expecting a steady decline.
The 10-year T-note continued to rally after Wednesday’s FOMC policy statement. This pushed the four-hour chart into extreme overbought territory as well (see chart).
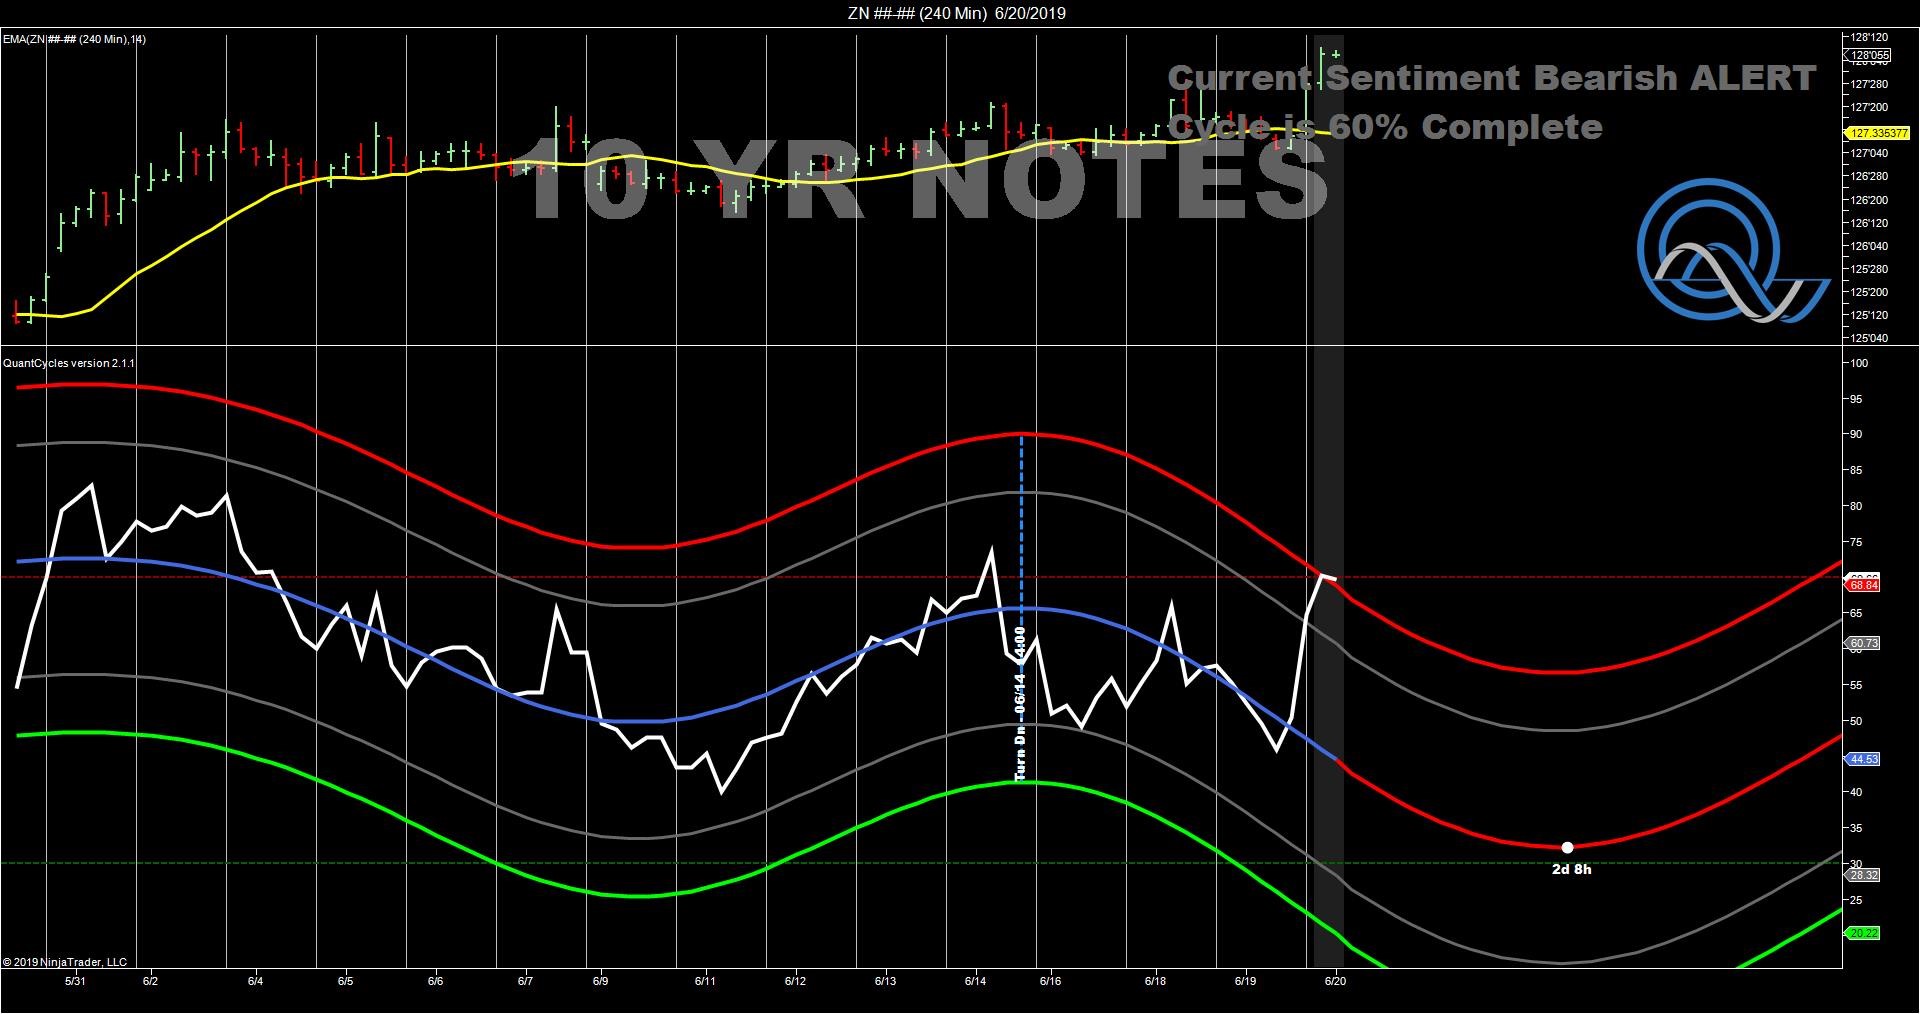
This confirmation across timeframes provides a strong sell signal, and with the Fed announcement out of the way, a great trading opportunity.
John Rawlins described the value of the QuantCycles Oscillator recently at The Orlando MoneyShow.
The QuantCycles indicator is a technical tool that employs proprietary statistical techniques and complex algorithms to filter multiple cycles from historical data, combines them to obtain cyclical information from price data and then gives a graphical representation of their predictive behavior (center line forecast). Other proprietary frequency techniques are then employed to obtain the cycles embedded in the prices. The upper and lower bands of the oscillator represent a two-standard deviation move from the predictive price band and are indicative of extreme overbought/oversold conditions.


