
When the yield curve in three-month Eurodollar futures and treasuries diverge, it creates reversion trading opportunities, writes Paul Cretien.
The data that we receive on Eurodollar futures trades generally shows prices equal to 100 minus the quarterly interest rate for 40 quarters, or a full 10 years of Eurodollar futures maturities. The 40 quarterly rates can be used to compute the Eurodollar yield at each of the 40 maturities. The yield at each maturity is equal to the average of all quarterly rates leading up to that maturity. The averages of the preceding rates are calculated as a series of geometric means.
As shown in the chart below (Eurodollar Rates and Yields July 15, 2019) the Eurodollar yield curve is usually a very good match for the U.S. Treasury yield curve.
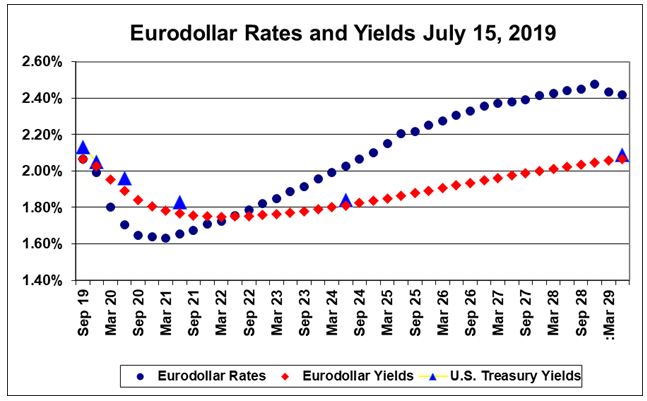
Aside from the remarkable ability of 40 independently traded futures contracts to produce a smooth yield curve that matches the Treasury yield curve, it is obvious that the short-term Eurodollar rates have to work hard to produce the correct yield curve.
In terms of profitable trades, we are looking for instances in which the Eurodollar yield curve does not match the Treasury curve. For example, if the Eurodollar yield curve is above the Treasury curve, this would be a signal to buy Eurodollar futures and expect Eurodollar quarterly rates to fall, bringing the Eurodollar curve down to equal the Treasury curve and at the same time causing profits from buying the Eurodollar futures. This is a reversion to the mean trade.
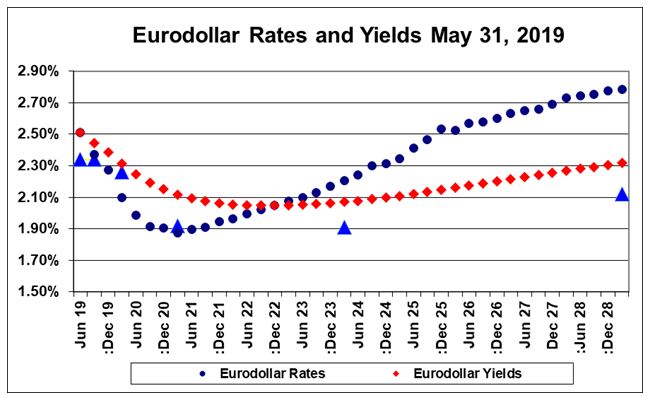
The second chart (Eurodollar Rates and Yields May 31, 2019) shows a situation in which the spread between the two curves was approximately 20 basis points, or $500 at the Eurodollar futures price change of $25 per basis point. Taking advantage of variations between the Eurodollar futures yield curve and the treasury yield curve can potentially lead to strong profits.
As you can see, traders can exploit short-term divergences in Eurodollar and Treasury yields.


