
Natural gas is one of the more volatile markets that has strong seasonal tendencies, writes Andy Hecht.
Natural gas can be one of the most volatile commodities that trade on the futures market. Since 1990, the price has traded from lows at $1.02 to a high at $15.65 per MMBtu. Over the past three decades, the fundamentals for the natural gas market changed dramatically. Discoveries of massive natural gas reserves in the Marcellus and Utica share regions of the United States and technological advances in hydraulic fracking increased the supply side of the fundamental equation.
Since necessity is the mother of invention, natural gas has replaced coal in the United States for power generation. At the same time, technology to liquefy natural gas has expanded the addressable market for the energy commodity. Natural gas used to depend on the U.S. pipeline network for delivery. Today, it travels around the world in liquid form by ocean vessels. Therefore, the demand side of the fundamental equation in natural gas expanded with the supply side.
The growth of the natural gas market has caused volume and open interest in the future market to explode since 1990. Increased demand for hedging by producers and consumers combined with speculative interests in the market was a bonanza for liquidity. The growth of the market reduced some of the price volatility from the earlier years that took the price north of $10 per MMBtu. Natural gas has not traded above the $10 level since 2008, the $6.50 level since the same year, and above $5 since 2014.
Natural gas is a seasonal commodity. The price tends to peak during the time of the year when inventories decline from mid-November through March. The offseason runs from April through October. With the peak season for demand on the horizon, price volatility is picking up in the natural gas futures market.
November Test of 2014 High
Last November, as natural gas was entering the 2018/2019 withdrawal season (period when inventories decline), the price of natural gas exploded to the upside.
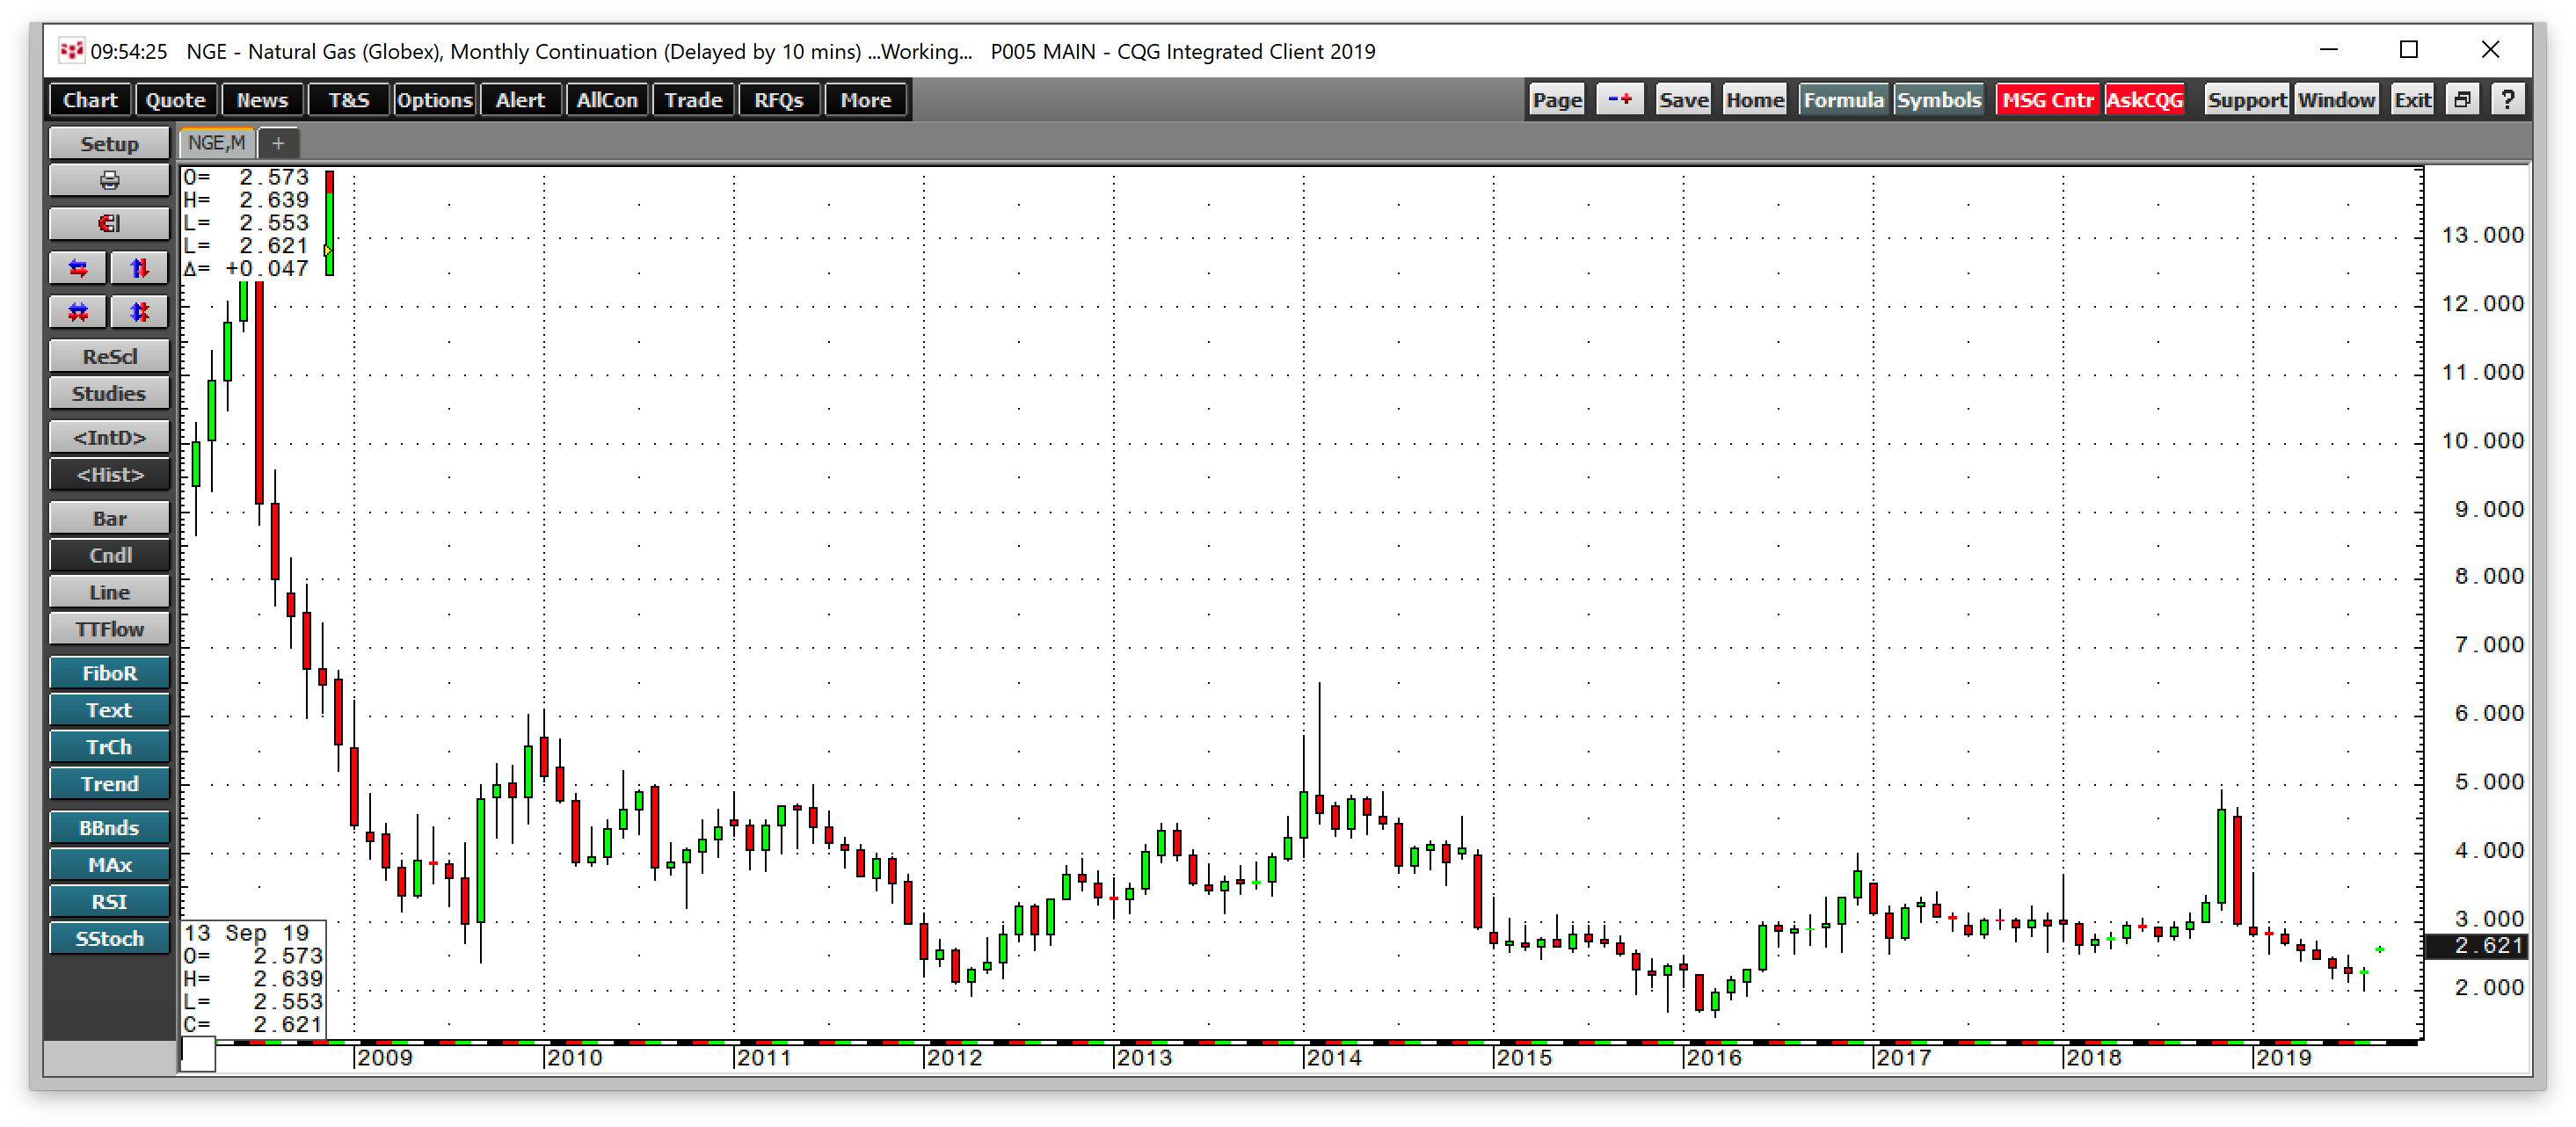
The monthly chart (below) highlights the price rise from a low at around the $2.70 level during the summer months to a high at $4.929 per MMBtu in November 2018. At the start of the withdrawal season, the total amount of natural gas in storage in the United States rose to only 3.247 trillion cubic feet, the lowest level in years. The low level of stockpiles, uncertainty over the weather and demand for heating over the winter months, and an early cold snap created a perfect bullish storm for natural gas futures. The price rose to the highest level since 2014 at the start of the 2018/2019 winter season.
The lowest price since 2016 in August
The November 2018 high ran into selling at just below the $5 per MMBtu level. The demand for natural gas last winter did not send the amount of the energy commodity in storage below the one trillion cubic feet level. At the end of last winter, stocks fell to a low at 1.107 tcf. However, the price started dropping in December and posted eight consecutive months of losses.
Technical support for the natural gas market was at the $2.53 per MMBtu level, which was the low from February 2018. During the same month in 2017, natural gas fell to a bottom for the year at $2.522, so it appeared to put in a higher low. In February 2019, the trend seemed to continue as the low for the month was at $2.543 per MMBtu. However, in April, it moved through the 2018 and 2017 and kept on falling.
In August natural gas futures found a bottom at $2.029, the lowest level since 2016 when the price fell to $1.611, the lowest level since 1998. A warm winter and high levels of inventories drove the price to the lowest level of this century.
A technical break to the upside
After the early August low in the natural gas futures market, a recovery got underway (see chart).
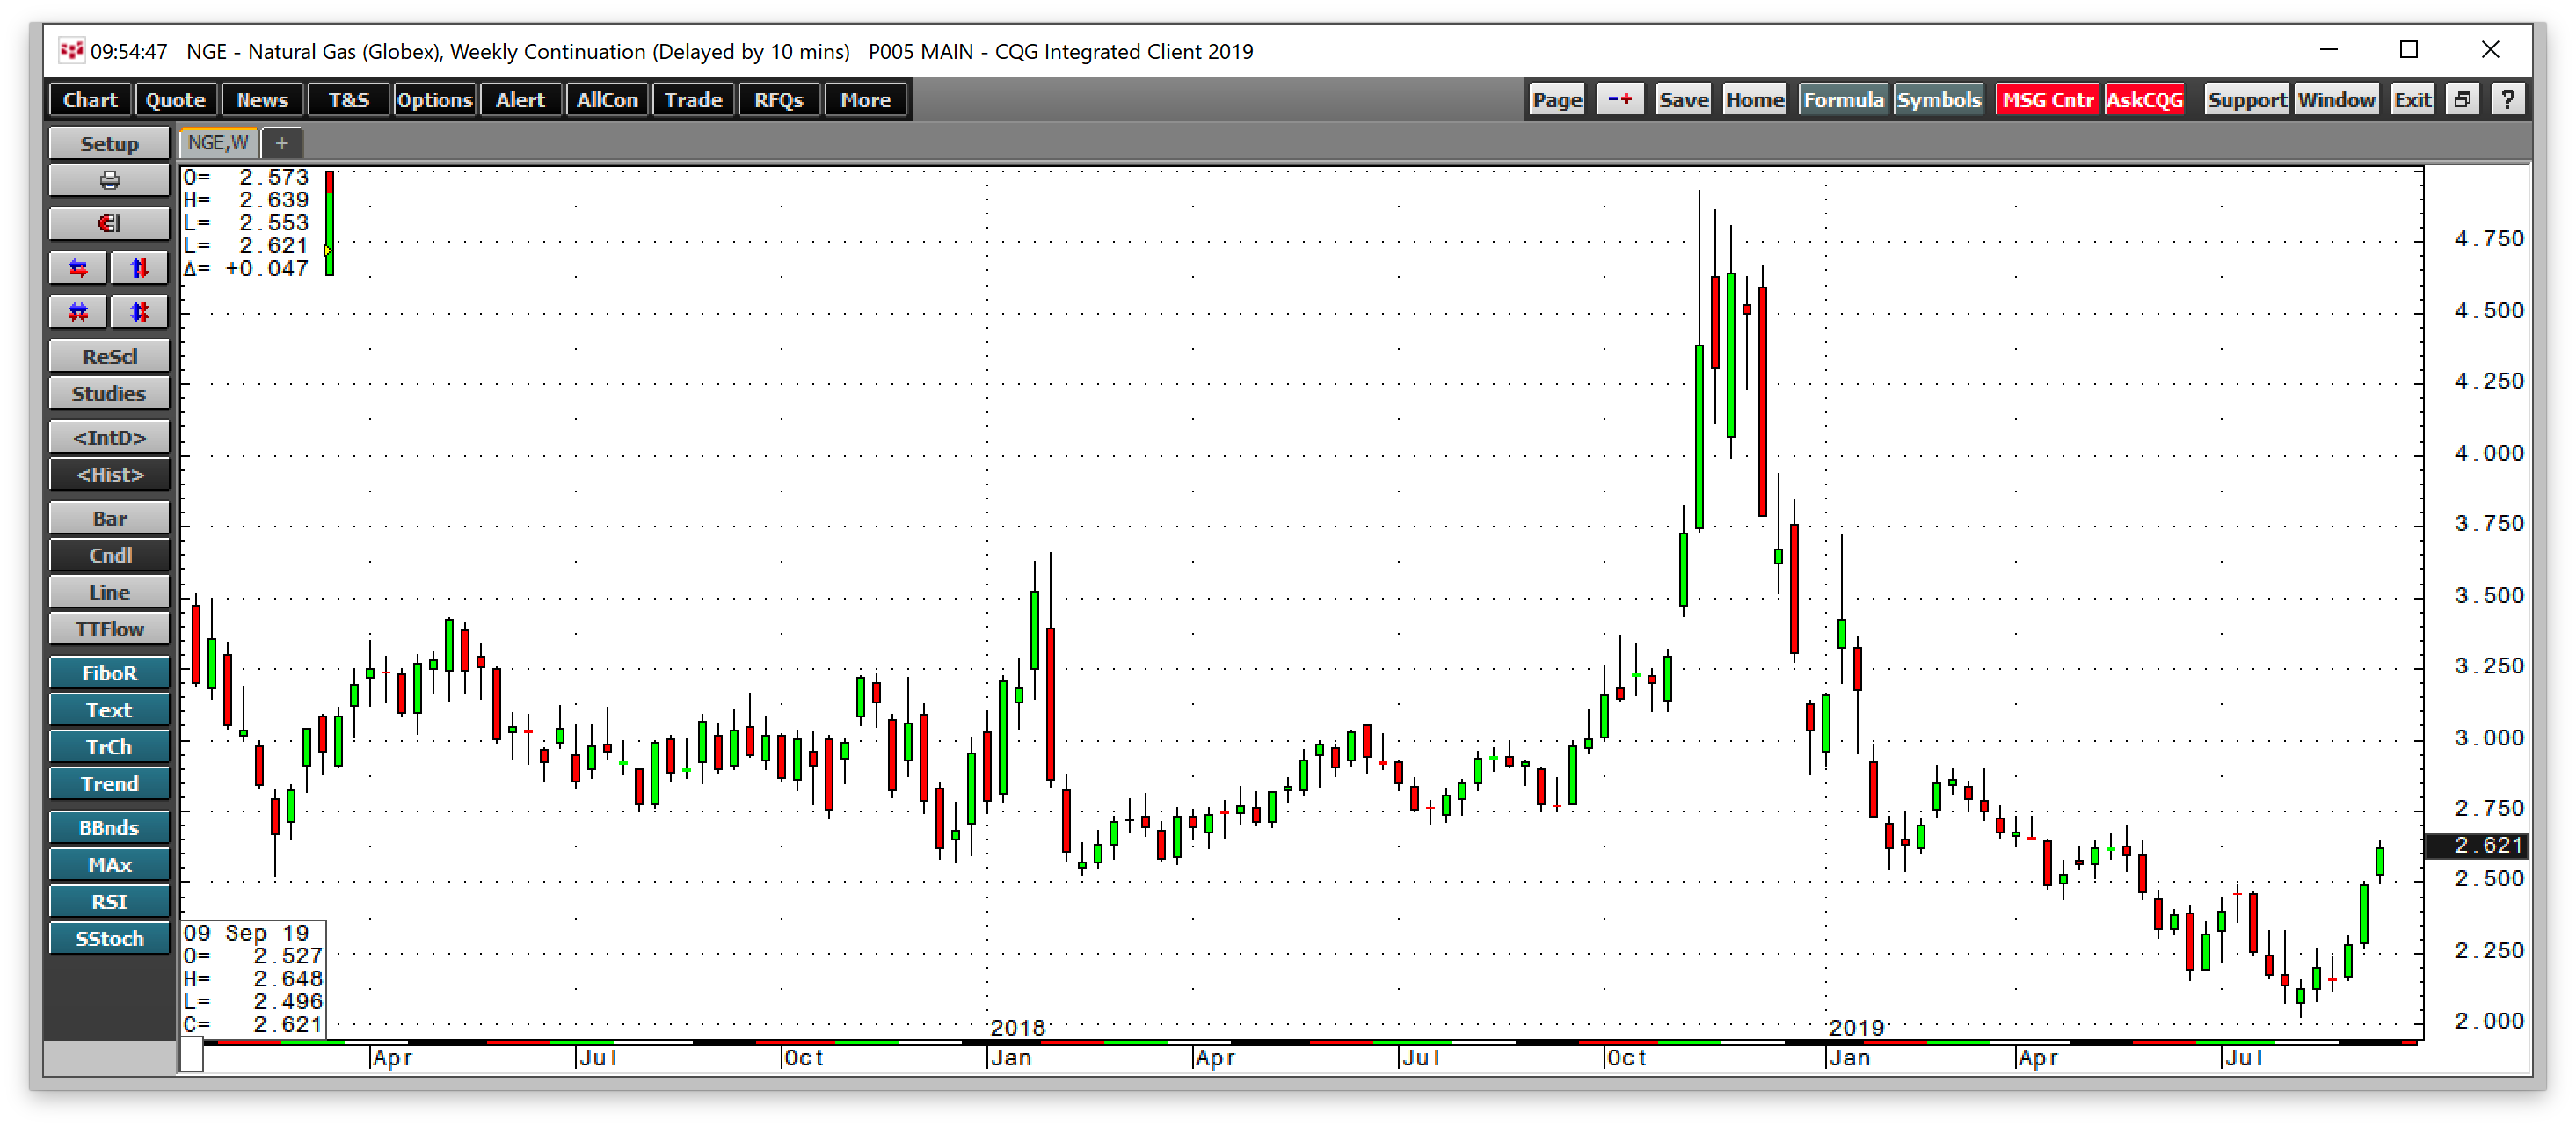
The wekly chart illustrates that the low during the week of Aug. 5 led to a rally that took the price higher in five of the last six weeks. The rally got some fuel as Hurricane Dorian approached the United States in late August. Even though the storm did most of its damage in the Bahamas, the price of nat gas continued to gain. Another sign that natural gas was heading higher was that the inventory report from the Energy Information Administration (EIA) as of Aug. 30 was bearish as the injection was higher than market expectations. When a market has reasons to move lower, and it continues to rise, it is a sign that the path of least resistance for the price is higher.
The level of critical support at the 2017 and 2018 lows at $2.53 and $2.522 gave way in April 2019, and the support levels became technical resistance when the price of the energy commodity traded to just over the $2 level in early August. Last week, natural gas took out those levels in post-summer trading and rose to a high at $2.648. The October futures contract settled the week at $2.614, not far below the high of the week and well above the level of resistance at $2.53.
Nat Gas Seasonals & Long-term Prospects
As Summer gives way to Fall and cold weather begins to descend over broad areas of the United States inventories begin to decline. As of the week ending on Sept. 6, the total amount of natural gas in storage across the United States stood at 3.019 tcf, 15% above last year’s level, but 2.5% below the five-year average for this time of the year according to the EIA.
Natural gas stocks will rise to a higher level than last year when the withdrawal season begins in mid-November, as stocks are likely to peak at the 3.7-3.8 tcf level. With nine weeks to go in the injection season (period to prepare for winter without a great demand for heating or cooling), stocks are not likely to increase to a record level above the four trillion cubic feet level.
The weather conditions over the coming winter months will be the primary factor when it comes to the price path of the commodity. However, the uncertainty of the season is likely to create at least one significant rally over the coming months. The highest price for natural gas futures during the coming winter months was for the January futures contract, which was at just over the $2.90 level after the recent rally.
The price of natural gas moved 58.5¢ per MMBtu higher since the early August low as of last Friday or 28.8%. The rally may have come a bit too early (due to a heat wave in the West) as we are only in the middle of September and the withdrawal season will not arrive until mid-November. Therefore, we should expect two-way volatility to increase over the coming days and weeks in the always volatile natural gas futures market.
When it comes to the longer-term direction of the price of natural gas, a comment by a candidate for President could cause a shift in expectations over the coming year. Senator Elizabeth Warren has said that she would end fracking in the United States on the first day of her administration if elected. Since the United States is now the Saudi Arabia of the natural gas market and has replaced Saudi Arabia as the world’s top oil-producing nation we could see lots of volatility in oil and gas prices if a significant amount of global supplies are impacted by a shift in U.S. energy policy starting in early 2021. The reelection of the incumbent President would ensure a continuation of the U.S.’s role as the leading producer of the two energy commodities. However, if Senator Warren’s energy proposal winds up in the platform of the Democratic party, we could see a significant price reaction in all energy-related assets.
UGAZ and DGAZ for those who do not trade futures.
When it comes to the short-term prospects for the natural gas market, we are entering into a time of the year when volatility tends to increase. The recent rally may have come a little too early, which means we may see some wider price swings over the coming days and weeks.
Price volatility creates a paradise for nimble traders with their fingers on the pulse of markets. The potential for price variance in the natural gas market makes it the Garden of Eden for opportunities (and risk) at times. The most direct route for a risk position in the natural gas market is via the futures and future options that trade on the NYMEX division of the CME Group. For those who do not venture into the leveraged and volatile futures arena, the VelocityShares 3x Long Natural Gas ETN (UGAZ) and VelocityShares 3x Inverse Natural Gas ETN (DGAZ) bullish and bearish ETN products provide an alternative.
I would be a scale-down buyer of any price corrections over the coming weeks leading into the winter season. Natural gas is a market that offers volatility, and now is the time to put the energy commodity on your trading radar.
Andy Hecht covers Commodities and Forex as one of the original contributing analysts at FATRADER.com. A former senior trader at one of the world’s leading commodities trading houses, Philipp Brothers (now part of Citigroup), Andy has worked and consulted for banks, hedge funds, and commodities producers and consumers around the world for over 35 years. Andy will be speaking at the TradersEXPO Las Vegas on Nov. 9.


