
Copper, the smartest and most predictive of all commodities, has had an impressive run and may be at a significant turning points, notes Daniel Collins.
There has been a silent confidence in markets this summer that most analysts find perplexing. Some true believers actually think we are entering a recovery. However, most analysts point to the massive intervention by the Federal Reserve—call it Quantitative Easing (QE) Coronavirus pandemic edition—that has made it difficult to not invest in risk, equities in particular.
But there could be a third option. The one market that fundamentalists look to when trying to predict futures global economic growth is copper. It is referred to as Dr. Copper, by some, for its ability to foretell economic cycles. This isn’t magic, copper is a key component of most durable goods, the bump in purchases of which indicate consumer confidence. There is approximately 55 lbs. of copper in the average car (www.rotaxmetals.com) and 439 lbs. of copper in the average home (www.copper.org). So, an increase in copper demand as demonstrated by rising prices, typically indicates economic growth on the horizon.
Copper made a multi-year bottom on March 23, which corresponded with the Covid-19 bottom in the S&P 500. Copper has gone on a massive rally, gaining more than 40% since March 23, from $2.10 per lb. to $2.95 per lb. on July 21.
So, it is appropriate to take a look at what the QuantCycles Oscillator is showing for copper.
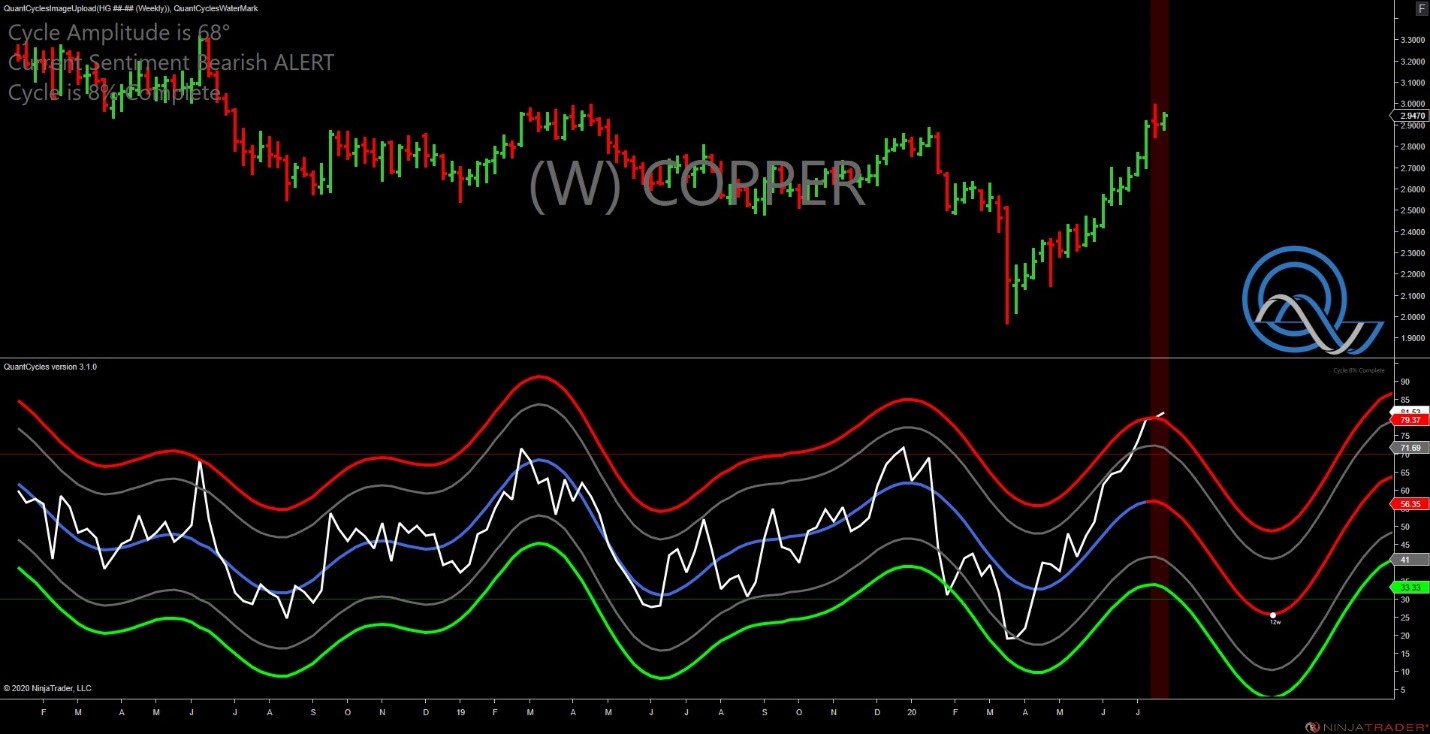
The long-term (weekly) oscillator has recently turned bearish just as it moved into extreme overbought territory. It projects a sharp downward move for the next four months (see chart below). This is an extremely bearish indicator.
The daily oscillator moved near extreme overbought territory last week just as the oscillator turned bearish, before the slight correction. Now copper is setting a double top from last week and is once again touching overbought territory (see chart below).
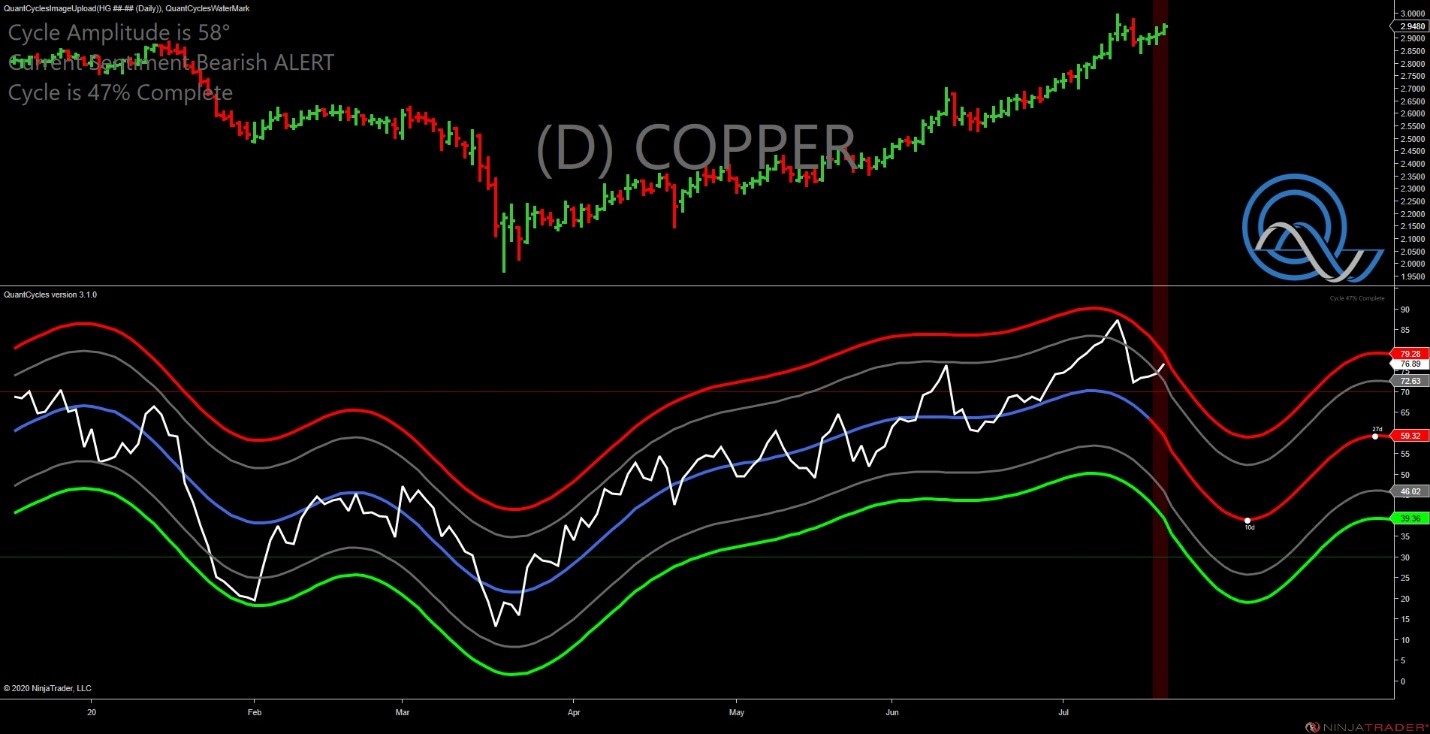
The daily chart confirms the bearish outlook from the weekly. This is not only a strong sell signal for copper, but perhaps for all risk assets.
John Rawlins described the value of the QuantCycles Oscillator recently at The Orlando MoneyShow.
The QuantCycles indicator is a technical tool that employs proprietary statistical techniques and complex algorithms to filter multiple cycles from historical data, combines them to obtain cyclical information from price data and then gives a graphical representation of their predictive behavior (center line forecast). Other proprietary frequency techniques are then employed to obtain the cycles embedded in the prices. The upper and lower bands of the oscillator represent a two-standard deviation move from the predictive price band and are indicative of extreme overbought/oversold conditions.


