
There has been much ado about "death crosses" among the talking heads of Wall Street, particularly regarding the so-called "FAANG" stocks, observes Bernie Schaeffer, founder and CEO of Schaeffer's Investment Research.
Case in point: A MarketWatch headline on Nov. 20 warned, "Netflix's 'death cross' is the third for FAANG stocks and Nasdaq Composite is next."
Against this backdrop, it's no surprise to find the First Trust Dow Jones Internet Index Fund (FDN) — which sports FAANG components Facebook (FB), Amazon (AMZN), Alphabet (GOOGL), and Netflix (NFLX) among its top holdings — making a death cross of its own. But is this ominous-sounding technical indicator really a harbinger of more downside?
The exchange-traded fund saw its 200-day moving average move north of its 50-day moving average on Friday, Nov. 16. It was FDN's first death cross since February 2016, right around the time the shares were putting in a bottom around $57.
Since that cross, the ETF enjoyed a slow burn higher, rallying more than 150% into its July 2018 record high of $147.73. In fact, after its Feb. 9 closing low of $57.73, the internet fund was up roughly 20% within the next month, settling at $67.88 on March 4, 2016.
Since 2008, there have been four death crosses for FDN, which began trading in June 2006. After those signals, the fund was up an average of 4.59% one month later, and was positive 75% of the time.
That's even better than the ETF's average one-month return of 3.31% after a "golden cross" -- when the 50-day moves atop the 200-day trendline -- thought to be a bullish technical signal.
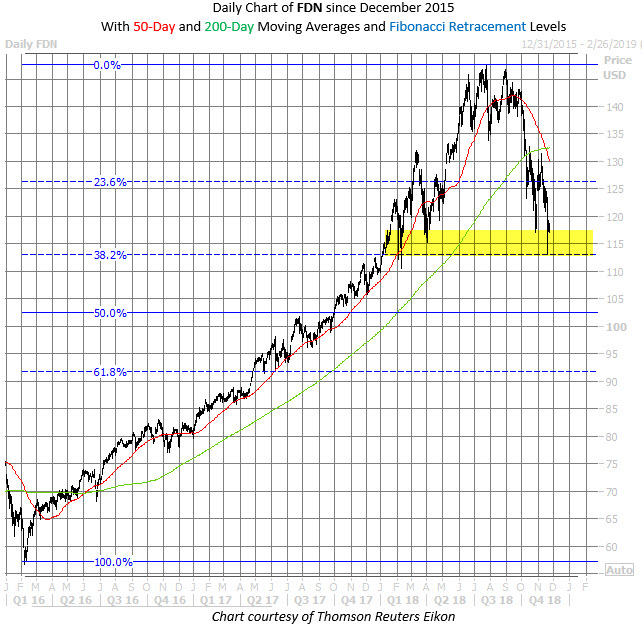
Further, the ETF is now testing an important area in the $113-$117 range. This region represents a 38.2% Fibonacci retracement of the rally from early 2016 to last July, and the $114.60 level represents two times that aforementioned February 2016 closing low.
In addition, the $116 region contained the ETF's pullback in April and again in late October. Plus, the fund's 24-month moving average is ascending into the neighborhood, and limited FDN's early 2016 sell-off; it hasn't been breached on a monthly closing basis since mid-2009.
Of course, we certainly won't guarantee that this area will again provide a layer of support in the event of other major fundamental blows to the tech sector; as always, technical analysis remains but one piece of the broader puzzle.
But with outflows in technology stocks totaling $1.5 billion in the past week — the biggest since February 2015, per BofA-Merrill Lynch — and FDN itself seeing more than $731 million in outflows since the start of October (per ETF.com), it's fair to question if the recent sell-off (and the hype about death crosses) is overdone.


