
Stock and commodity markets are nearing tipping points, and several signs are hinting that sizable moves may unfold this week. But will they be to the upside or downside?
By Chris Vermeulen
The past couple weeks have been choppy for the equities market. While the strong intraday moves are great for daytraders, it is extremely difficult for swing/position traders, who normally hold positions for between three and 60 days, which is the focus of my writings. That being said, we are reaching a "do or die" point for the equities market, and this week, there should be a strong move out of this trading range.
On the volume side of things, we have been seeing distribution taking place. Heavy volume continues to step into the market, unloading large amounts of shares. The interesting part is that the majority of traders are bullish and sentiment levels are at extremes. Also, we are seeing the retail trader enter the market.
What does this mean? It means we must trade very cautiously and not take large positions on the long side. The selling volume and extreme bullish sentiment are warning us that a correction is near.
There are a few things I watch to identify trend reversals, and they are accumulation or distribution of shares, extreme sentiment readings, market internals/breadth, and price relative to the 20-period simple moving average (SMA). Currently, we are seeing all the signs of a reversal to the down side, but it has yet to be confirmed.
My trading buddy JW Jones, who has written several option trading articles for MoneyShow.com, has been cleaning up with the current volatility, making 21%, 50%, and 67% returns on his last three trades. This guy loves volatility and always seems to put together an option play with very little risk, but with big upside potential.
Let's take a look at a couple charts.
S&P 500 60-Minute Chart - Past Two Months
This chart shows a possible trend reversal unfolding. We are seeing distribution selling, lower prices with the current price trading under a key resistance level. Also, my internal/sentiment indicators are showing waves of buying/bullish market action, which is quickly met with strong selling, thus pulling prices back down.
Trading during trend reversals is difficult because the potential downside risk is higher when entering a position. If traded, only small positions should be taken until a trend is established, then you can build/add to your position on pullbacks or bounces depending on the direction in your favor.
My current bias is for lower prices in the coming days, but until we break above February's high or last week's low with strong volume, it's a little more of a guessing game. If we see the S&P 500 rise early this week and fill the gap and the market internal indicators show extreme short-term overbought conditions, it will make for another great low-risk shorting opportunity. Shorting just under a key resistance level means the protective stop is only 1%-2% away from our entry point and makes for a solid 1:3 risk/reward ratio. On the flip side, if the market has a strong rally and closes above the key resistance level, then the tables will have turned and a new uptrend should start.
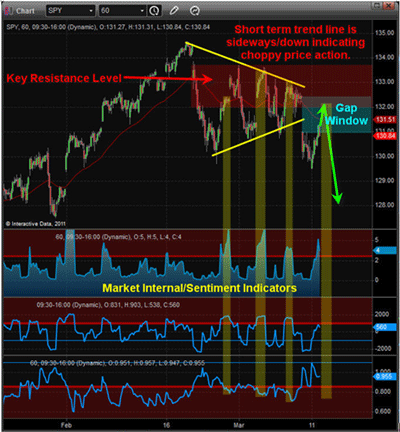
Click to Enlarge
NEXT: Timely Analysis of Gold's Current Patterns
|pagebreak|Gold 60-Minute Chart - Past Two Months
Gold has had a nice push up in the past few weeks due to the issues in the Middle East. We saw the yellow metal make a new high, but it has since pulled back down and could have another move lower in the coming week. The $1380-$1390 level should act as a strong support zone. The daily and 60-minute charts both show support at that area. Silver is in the same boat, so keep an eye this.
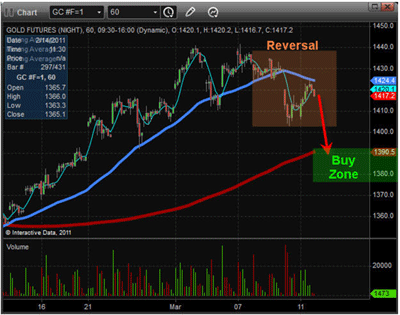
Click to Enlarge
Trend Analysis
In short, stocks and commodities are nearing a tipping point and there should be a large move in either direction starting this week if all goes according to plan. The big question is which way are prices going to go? My current bias is for more downside until we see a good washout in the market. It could be 2%-8% lower from where the market closed on Friday. After that, I think a grind higher into May could easily take place, but we will see how the charts unfold going forward.
Each week, there seems to be some type of surprise economic, political, or natural disaster of some sort, making trading not only tougher, but also riskier because price swings are large. Keep trading to a minimum and position sizes small for now.
By Chris Vermeulen of The Gold and Oil Guy


