

The US dollar index is in a clear downtrend, but with a test of a critical price level upcoming, a break of that level and a rally above it would significantly change the structural pattern on the charts.
I’ve been monitoring the changing structure in the US dollar index recently, and there is a very critical index level to watch that will signal an official, structural trend reversal on the larger frame.
Let’s take a look at the current price structure and highlight the critical level that will objectively redefine the prevailing trend.
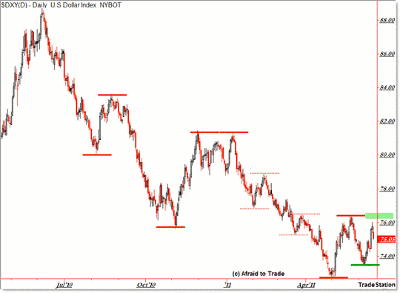
First, the daily chart structure:
Click to Enlarge
When you’re doing any sort of large-scale analysis of a price trend, sometimes it helps to strip away all the clutter and indicators so that you can clearly observe the simple price (trend) structure.
For a recap, “structure” refers to the prevailing sequence of swing highs and lows as a market makes a directional move.
Uptrends are thus defined as a sequence of higher swing highs and higher swing lows, and vice versa for structural downtrends.
The dollar index is in an objective (undeniable) structural downtrend, as seen by the horizontal lines connecting the series of lower swing highs and lows.
However, that structure (progression) is threatened by a looming reversal in the highs and lows at the $76.50 level. And here’s why:
In June, the index formed a higher swing low just under $74.00 and then rallied up recently into the swing high pivot at the $76.00 level.
A higher low does not reverse a structural downtrend by itself, but what would reverse the trend objectively is if the index continued on its progression to the upside and rallied above the $76.00 level.
NEXT: A Closer Look at the Critical Level to Watch
|pagebreak|In other words, to reverse a structural downtrend, price requires a higher low and a higher high to break the progression.
Thus, it will be important to watch the $76.50 level very closely in the weeks ahead.
Let’s zoom in on the down move so far in 2011 to get a better view of the structural level to watch:
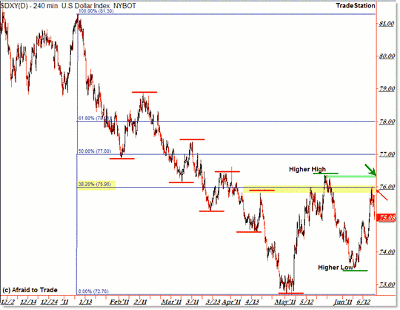
Click to Enlarge
It’s helpful to drop to lower (intraday) time frames to get a clearer picture of structure as it develops. I’ve also added a simple Fibonacci retracement grid.
As if by magic (I’m being sarcastic), price retraced from the confluence of the $76.00 index level and the 38.2% retracement.
That will be another level to watch for a bullish breakthrough, should it develop.
However, the level that defines a new uptrend from a continuation downtrend will be the $76.50 pivot level from the May high.
A breakthrough there reverses the structure to put in both a higher low and a higher high, signaling an objective reversal.
A large-scale reversal to the upside in the US dollar index is almost certain to coincide with a reversal to the downside in the stock market.
Thus, even if you don’t trade the dollar index or currencies, a wide scale reversal in the US dollar index trend—should that occur—would likely send shockwaves throughout the markets (stocks or commodities) you do trade.
Unless proven otherwise soon with a strong breakthrough above the $76.50 reversal level, the trend remains lower for the US dollar.
By Corey Rosenbloom, trader and blogger, AfraidToTrade.com


