Recent chart action in Harley Davidson (HOG) provides a fine example of a proven reversal pattern and how to use multiple time frames to spot, execute, and manage the trade effectively and profitably.
A reader recently asked me if we had a “kick-off” signal in Harley Davidson, Inc. (HOG) and indeed we did—with powerful follow through, as anticipated.
The entire event gives us a great lesson in the kick-off reversal signal, with the special emphasis on two-time-frame confluence support (on a retracement) where the kick-off reversal signal formed on the intraday frame.
Let’s take it step by step and learn from this excellent reference.
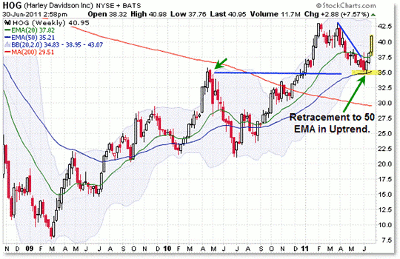
First, let’s build down from the higher frames beginning with the weekly structure:
Without getting too detailed, we note the “structure” (the sequence of swing highs and lows) reveals HOG to be in a persistent, long-term uptrend, triggered officially from August 2009.
Through most of 2011, the stock pulled back (retraced) to the critical confluence support level of $35.00 per share. It was both the rising 50-week exponential moving average (EMA) and the prior price swing high from April 2010.
To keep it simple, we’ll just refer to this as a “make or break” support level in the context of a multi-month retracement/pullback to support.
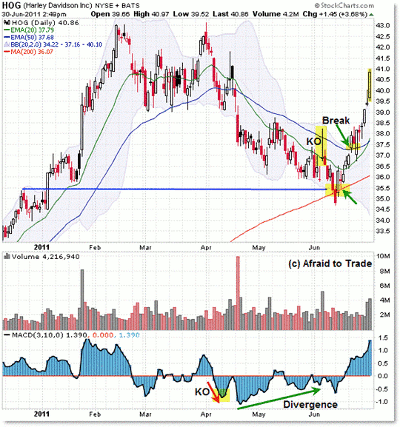
Now, we see the daily chart for more detail:
Again, keeping it simple, this “bearish” period on the daily chart (from April to June) was just a stable/simple pullback on the weekly frame.
The $35.00 level was our weekly reference price, and we can see a confluence with the rising 200-day simple moving average (SMA) along with a tiny prior price high from December 2010.
Now we see multi-time-frame (weekly and daily) expected support at $35.00 per share.
Towards the end, I described a situation where a higher-time-frame retracement to support occurs and then explained how a trader should drop to lower time frames (intraday) to see developing structure and whether or not a “kick-off” reversal signal forms there.
This situation in Harley Davidson is a great follow-along accompaniment to the presentation.
The chart above is “cheating,” as we can see the favorable resolution of the retracement, but to understand how this would have played out in real time, envision yourself seeing this at the beginning of June as price retraces into the $35.00 per share level.
There is a lengthy positive momentum divergence into this dual-time-frame support level as price retraces to test $35.00.
NEXT: See This Pattern on the Hourly Chart
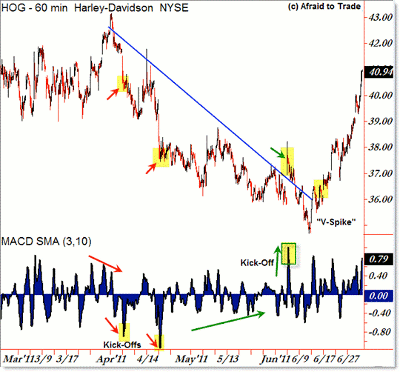
|pagebreak|Now, let’s drop down to the hourly (intraday) chart to assess what the structure revealed, including the kick-off reversal signal:
For fun, I labeled two “downside kick-off” signals in early April just for additional reference.
For our purposes here, we have price pushing down into the $35.00 confluence support level as visual positive momentum divergences form in the 3/10 oscillator.
Then, on June 6, Harley simultaneously breaks a short-term falling trend line and forms a kick-off early reversal signal.
To refresh, the kick-off signal triggers when price is moving down into positive divergences and then a price swing up results in a new momentum high (new oscillator high) in the indicator while price is not making a corresponding new high.
This is based off the teachings of Richard Wyckoff as a “hidden” sign of strength via momentum that price does not yet reveal.
Video: Profit from Wyckoff’s Timeless Methods
The trade generally is to buy the first retracement swing after a kick-off signal forms or wait to buy the actual price breakthrough above the “kick-off” price high (in this case, $38.00 per share).
Immediately following the kick-off signal on June 6, price swung down officially into the dual-time frame, make-or-break support level at $35.00 per share and then re-broke above the falling trend line on June 14 above $36.00 (an aggressive buy signal).
Shortly after, price then officially broke above the kick-off price high at $38.00, triggering a late-but-safe entry.
Due to the higher-time-frame confluence support, the stop loss for the bullish reversal play rested under $35.00 ($34.50 perhaps to give some wiggle room.
From there, price continued its strong impulse higher and moved quickly back to the $42.00-per-share swing high, allowing for a quick swing trade that was confirmed with multiple time frames and a kick-off.
To recap, we had a primary uptrend and a simple pullback/retracement to the dual-time-frame price confluence expected support at $35.00 per share.
While most traders find this to be enough information to put on a swing trade, other traders can “step inside” the developing structure to assess what’s developing on the intraday frame for clarity and better execution.
In this case, we had a positive momentum divergence into a kick-off early reversal signal and then a confirmation via a breakthrough of a falling trend line and then a break above the kick-off swing high at $38.00 (late entry).
You don’t have to go to this level of detail when planning/executing a trade, but for those who want to do so, this recent example in Harley Davidson gives a great lesson in dual-time-frame confluence support and integration of the intraday chart for a clearer perception of the opportunity, entry, stop-loss price, and real-time trigger(s) as the trade develops and confirms.
By Corey Rosenbloom, trader and blogger, AfraidToTrade.com


