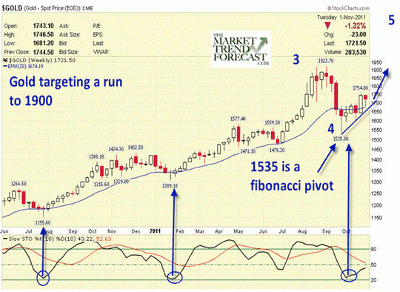
Gold has marked a key Fibonacci pivot point and may now begin a new wave higher, potentially reaching $1900 before year-end while on track to surpass the $2000 level in 2012.
It’s been several weeks since I’ve written about gold and we have had a wild ride since the $1910-$1920 highs in August. At the time, as we approached, I forecasted a major correction was nigh and we were shorting the rise from $1862-$1910 prior to a huge, $208 drop that took place over just a few days. We covered our short at $1725 and then gold rallied back to a double top at $1920 before falling to $1531.
That pullback to $1531 qualifies as a Fibonacci retracement of the 34-month rally from $681 to $1920 and would also qualify for a price low for a fourth major wave correction that I discussed in prior forecasts.
My initial targets for the gold pullback were $1480-$1520 if the $1650 area was violated. Most recently, we have seen gold run up to $1681 (another Fibonacci resistance zone) a few times and then back off to the low $1600’s.
With the recent push over $1681, we can now confirm the fourth wave is over at the $1531 lows and the fifth wave is likely in the very early stages, but beginning to build steam.
I will say that we want to make sure the $1650-$1680 areas are defended by gold on any pullbacks in order for this forecast to remain valid. During this fifth wave up, eventually we should see the $2380 range in gold, but it will not take place overnight.
See related: Gold’s Run Is Not Over
In the next few months, I am looking for gold to attack the $1900 range, possibly even by year end, and then attack the $2000-plus range in 2012.
With all of the macro events in Europe changing on an almost daily basis, the whipsaws in both the precious metals and equities markets are difficult to forecast and trade for most investors. However, gold has been moving in defined Fibonacci and wave patterns for ten years now and has about three years left in a 13-year bull cycle, if I’m right.
Below is the updated weekly chart for gold. You can see prior lows as they related to oversold indicators, and where we just came off the $1531 lows and its Fibonacci pivot along with the oversold indicators below.
Look for gold to attack $1775 first, then $1800, $1840, and $1900 in the coming six to ten weeks or so.
By David Banister of Market Trend Forecast


