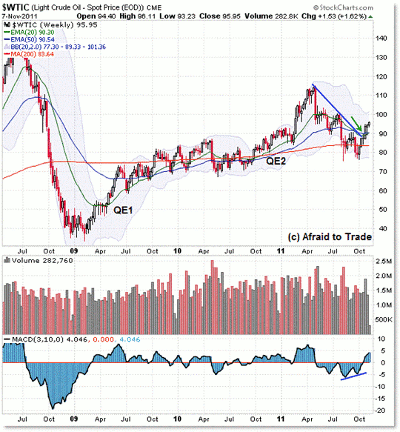
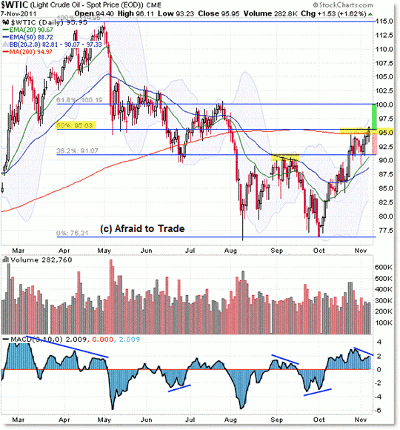
A look at the latest weekly and daily charts for crude oil reveals the important price levels acting as support and resistance, as well as the likely price targets that would result if those levels were overcome.
Let’s start with the weekly chart of crude oil and focus on the key price levels to watch going forward.
Stocks and crude oil performed well in October, breaking critical weekly (and of course, daily) resistance levels to shift the dynamic to the buyers.
In the bigger picture, oil (like stocks) benefited from the inflation generated by the two prior rounds of quantitative easing (QE1 and QE2). One would logically assume a third round of QE—should it happen—would also be supportive for oil prices.
Back to the charts, oil broke through a confluence exponential moving average (EMA) barrier at the $90 level in October, bringing us firmly above the $90 confluence.
Beyond the EMA confluence, oil broke through a falling overhead trend line, which shifted the trend structure back to the bullish case.
Without getting too detailed, oil is in “open air” bullish territory so long as price can remain above $90, which has even more support as we can see on the daily chart:
I’ve annotated the chart more than normal, so let’s take it one step at a time.
Starting with the downward Fibonacci retracement grid, price broke above the 38.2% level at—big surprise—$91 in October, and now challenges the 50% overhead retracement at $95.50.
Further bullish strength above $95.50 would be expected to carry price to the upper 61.8% level, which forms a price confluence from a prior swing high in July. The $100 level is thus your simple upside target.
Otherwise, the flat 200-day simple moving average (SMA) resides at $95.00, and $95 has been a “price polarity” level (you can see price forming both support and resistance there).
I mentioned the “floor of support” at $90, which is enhanced by the rising 20- and 50-day EMAs clustering there.
The Main Idea
Further strength above the $95/$95.50 confluence could result in a movement up to the $100 level (“open air” on both the daily and weekly chart), while a quick turnaround (retracement) here would be expected to challenge the support again near the $90 confluence.
Going beyond the immediate range between $90 and $95, a breakdown under $90 would be a very bearish sign, just as a firm breakthrough above $100 would be a bullish trigger.
Watch these objective (non-biased) levels in conjunction with new/real-time developments along the way.
By Corey Rosenbloom, CTA, trader and blogger, AfraidToTrade.com
Meet Corey and attend his presentations at an upcoming Traders Expo.


