Greg Harmon of Dragonfly Capital uses three types of chart analysis to determine where the price of silver and the silver ETF may be headed next, along with specific price targets.
Gold has had a spectacular move over the last few days, and it makes one wonder whether silver, both the futures and the iShares Silver Trust ETF (SLV), will join it. The three views below might bring some clarity.
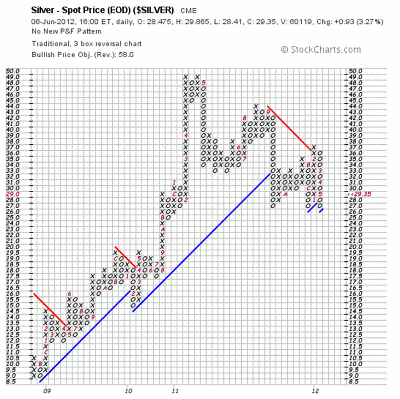
The 3-box reversal Point and Figure chart below is a good starting point. Clean and objective, it suggests a bullish move with a Price Objective of 58.00. A print with a 30 handle will start the new row of X’s.
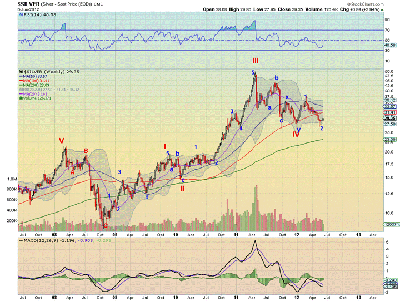
But this gives no guidance in terms of timing. So lets move on to the Elliott Wave chart below. I have put this chart out before, and you can see that it came very close to negating the count before printing a 2 with a near full retrace of the 1 move higher.
A reasonable target for wave 3 would be between 38.16 and 45.22, 100% to 161.8% of the wave 1 move higher. Assuming a 50% pullback in wave 4 brings it at the high end to 35.97 and the low end 32.44, the range for wave 5 then caps it higher to 54.46 in the higher track and 43.87 in the lower track.
The high estimate is very close to the Point and Figure estimate, but it may take a long time to get there. Wave 5 can be estimated as comparable to the 15-month moves of wave 1 and 3, and that would place it at the end of March 2013.
With a corrective wave following and then another move higher, it could be 2015 before 58 is achieved. Of course it could happen much quicker as well, if wave 3 ends up as a multiple of wave 1.
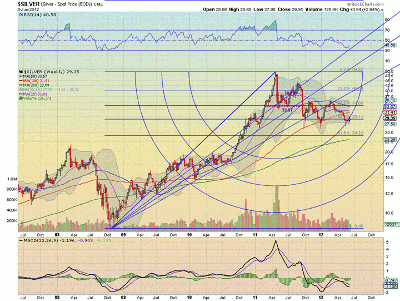
The Fibonacci view is a lot more mixed. The chart below shows it bouncing along the 50% retracement of the move higher, unwilling to drop much below it, and not able to push back above a retest of the 38.2% Fibonacci level. Perhaps that was because the Fan line knocked it back.
With the new move higher as it walked through the Arc, that 38.2% level at 34 becomes the first upside target, and a move over that a retest of the 23.6% Fibonacci at 40.04.
The Arc suggests those could happen as soon as July and August. With the Fan line around 42 then, it would be a logical spot for the wave 3 action to end and consolidation to begin in a flatter wave 4 before the final push higher in wave 5.
Of course, on a move below 26.20 you can throw this article away and start your analysis again on fresh charts!
Greg Harmon can be found at Dragonfly Capital.


