Trader and blogger Brian Lund of BCLund.com shares the charts of some stocks that he sees exhibiting promising patterns for the week ahead.
In last week’s post, there were nine long setups and one short. None of the longs triggered and the short triggered only to be a scratch by the end of the week. That is typical for the market we have been in the last few weeks.
This week I see a lot of “extended flags”—flag patterns on stocks that have gone on a bit longer than they should have. This week will probably tell if most of those flags fail or break to the up side. All the setups this week are long, but all bets are off if the broader market tanks.
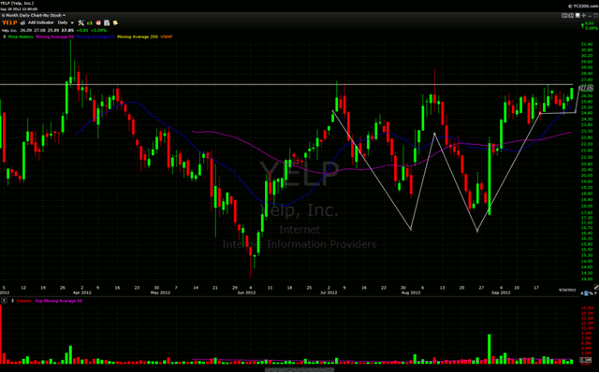
YELP has been on the list three weeks running, and each week the chart has looked better and better. If it breaks the large “W” pattern and can hold, the measured move is about 10 pts or to around $37.00. Buying a break above $27.40 with a stop two bucks below gives you about a 1:5 risk/reward ratio trade.
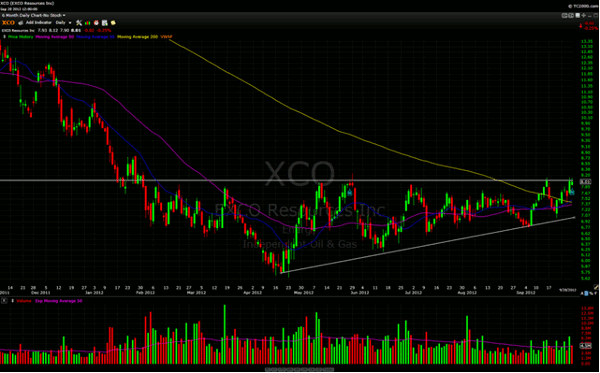
This is the only “non-flag” setup on my list this week. XCO has a nice long basing/bottoming pattern. It has tested the $8.00 level a number of times and each time, the odds that it will break increases. You could use Friday’s candle for entry/stop.
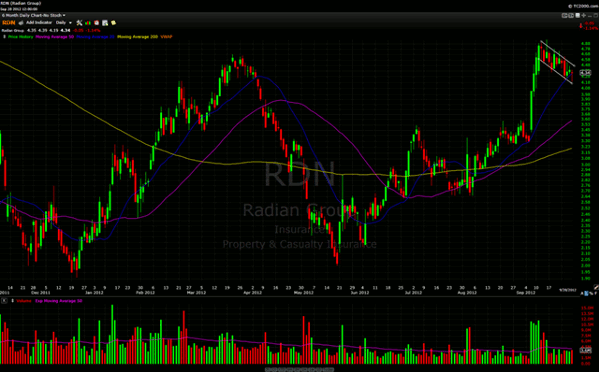
RDN is one of those “extended flags” I was talking about. It’s almost getting too long, but it has the right range and volume pattern. This could be the make or break week.
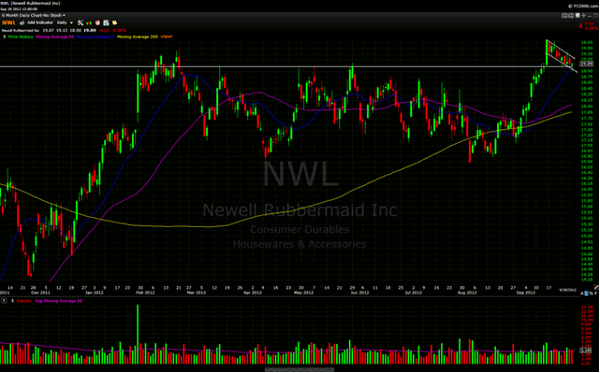
A nice flag that pulls back right from an 18-month high. Keep an eye on NWL.
NEXT: More extended flags that show promise. |pagebreak|
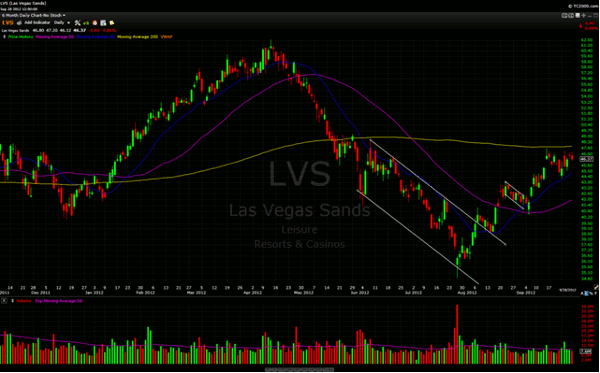
LVS came out of a large channel, flagged, broke out, flagged, and broke out again. Now it is starting to base under its 200ma. It needs a couple more days of sideways movement but then it could be ready to go.
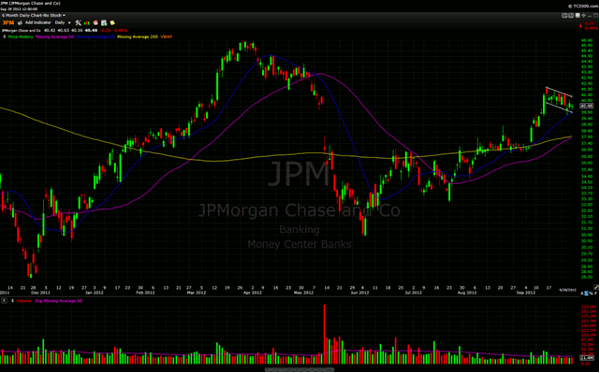
Financials have been looking healthier, starting with a move in MS in early September. JPM is showing a flag right below gap resistance.
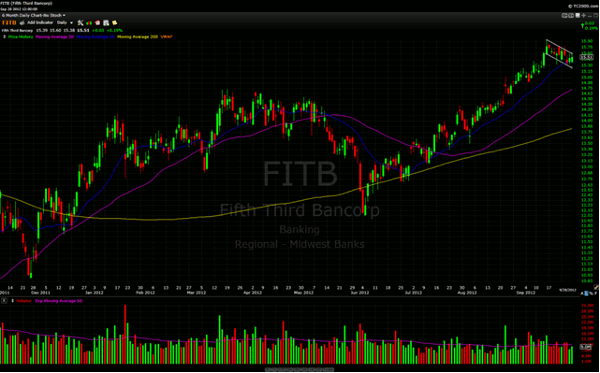
FITB is another financial that is flagging near two-year highs.
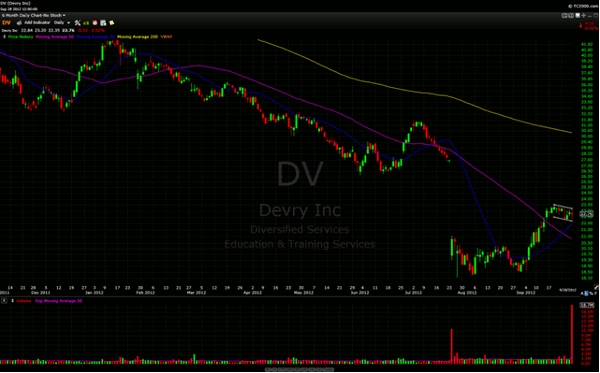
Last year, so-called “alternative schools” were all the rage, then fell out of favor. DV has recaptured its 20 and 50ma and is flagging here. A break above $23.25 with a buck lower stop, and a target of the gap at $27.50 gives you a 1:4 risk/return ratio trade.
NEXT: Three more charts to watch.
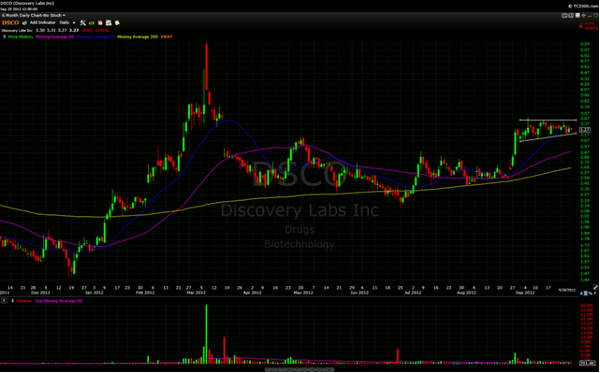
|pagebreak|A progressively tightening consolidation below a gap resistance level could set up a nice pop in DSCO.
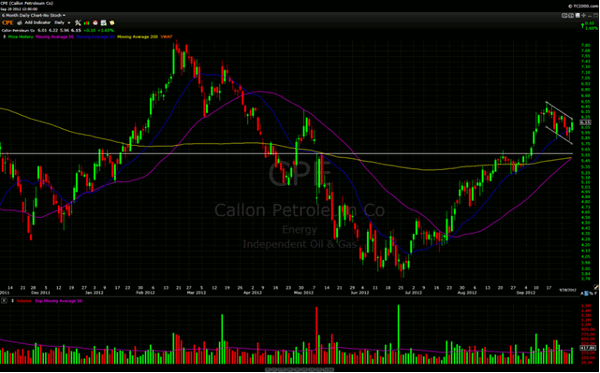
Not the best looking flag in CPE (a bit sloppy), but it does make somewhat of a “handle” on a cup and handle “type” of formation. *Note: Cup and handle is traditionally more valid on a weekly chart and beginning of the “cup is usually a pivot high unlike this chart. However, I still think the price action is bullish.
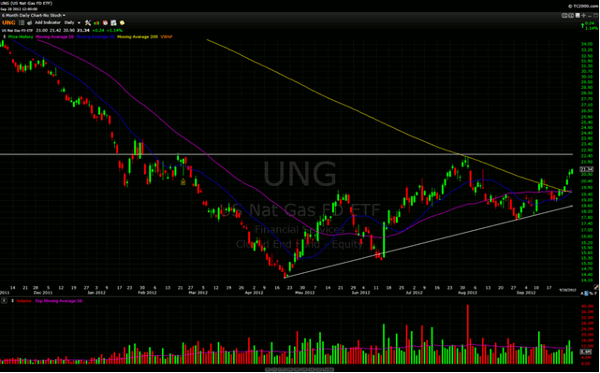
BONUS: Not a set up, but something to watch. The ETF UNG, which represents natural gas is moving up with progressively higher highs. It has recaptured its 200ma for the first time in over a year. Keep a watch on.
Brian Lund can be found on BCLund.com.


