

With the market notching all-time highs day after day, PikerTrader on SharePlanner.com points out an interesting pattern forming in a popular tech stock.
YELP has ripped up about 20% since its gap up on May 1. Since then, it has not moved much since it made its high on May 3. That being said, it has been chopping around in a 4%-7% range, which is a decent size range. What YELP has done is consolidated since its move and formed a triangle pattern, which is known as a continuation pattern.
Since we have the triangle forming after a breakout/uptrend, we should focus on YELP breaking this pattern to the upside and continuing its upside movement. This would mean a break of about 31.50 to be on the safe side. We can see from the chart that YELP is sitting on the bottom of the triangle and support, so it is a logical bouncing point. The pattern would be voided if YELP was to drop below 29.74, at the point you are looking to see if YELP can stay above its low at 28.78, but that's neither here nor there.
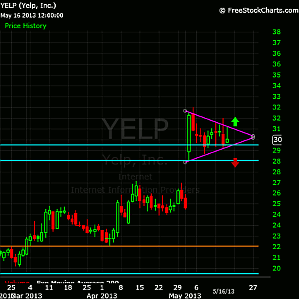
Click to Enlarge
The way to play this right now is to watch for a breakout of the upside as this is what our chart is telling us could happen.
By PikerTrader, Contributor, SharePlanner.com


