These stocks are trending higher, but have slipped in the last few trading sessions, thereby offering an attractive opportunity to buy on the dip, writes Stoyan Bojinov on CommodityHQ.com.
Week two of the government shutdown is here and politicians have offered little to no hope that a prompt resolution will be enacted prior to the much-feared October 17 debt-ceiling deadline. Although many speculate that the US will avoid default even if the deadline is missed, it’s undeniable that such an event has the potential to trigger a much steeper correction on Wall Street, especially since major stock indexes are still up double-digits YTD.
The sideways grind on Wall Street has prompted bargain shoppers to look for trending stocks at attractive levels. As such, below we take a look at two big commodity stocks that are trending higher, but have slipped in the last few trading sessions, hereby offering an attractive opportunity to “buy on the dip,” especially if developments on Capitol Hill turn for the better in the near future.
The stocks included here are rated as “buy” candidates for three reasons: First and foremost, each of these companies boasts a market cap upwards of $1 billion along with average daily trading volumes topping the $1 million mark, in an effort to weed out smaller, more volatile trading prospects; second, these securities are trading above their 200-day moving averages, thereby implying they are in longer-term uptrends; thirdly, these stocks are also trading below their five-day moving averages, which makes them attractive for swing traders looking to buy in before they rebound. As always, investors of all experience levels are advised to use stop-loss orders and practice disciplined profit-taking techniques.
Ashland Inc. (ASH)
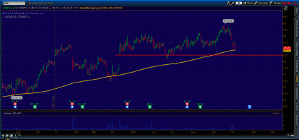
Consider ASH’s one-year daily performance chart below.
ASH is heading towards a key support level below its 200-day moving average (yellow line). Notice how this stock managed to rebound off $82.50 a share (red line) in late June; furthermore, this stock has managed to hold its bullish gap from 4/12/2013, suggesting that longer-term buyers have not left.
Freeport-McMoRan (FCX)
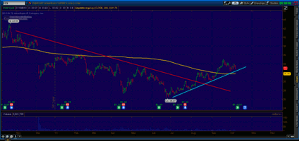
Consider FCX’s one-year daily performance chart below.
FCX is showing signs of a trend reversal judging by the fact that it has managed to rise above its 200-day moving average (yellow line) while posting higher-lows (blue line) along the way. What’s even more encouraging is that FCX appears to have broken its trend of lower-highs (red line) and is on its way to establishing a new uptrend.
By Stoyan Bojinov, Contributor, CommodityHQ.com


