After enduring a beating which began on October 30, biotech stocks have regained most of their strength, writes John Burke of Wall Street Sector Selector.
Since October 30, investors began getting used to seeing red numbers after the ticker symbols of biotech stocks. It fact most “momentum” areas of the technology sector have been taking a beating. Solar stocks and semiconductor companies are regaining their footing after a tough bout.
By Tuesday’s closing bell, all of the major biotech ETFs were still below their 50-day moving averages. Meanwhile, both the Market Vectors Semiconductor ETF (SMH) and the iShares PHLX SOXX Semiconductor Sector ETF (SOXX) managed to close above their 50-day moving averages during the entire period beginning on October 30 through Tuesday.
During Tuesday’s trading session, the standout biotech stocks included Natus Medical (BABY), which jumped 7.77% to $21.08. The stellar stock was Vanda Pharmaceuticals (VNDA), which skyrocketed 95.93% to $13.30. The FDA website contained a report that an advisory panel will vote on Thursday as to whether to recommend approval of Vanda’s drug, Tasimelteon, which has been found to help blind people sleep. Because blind people cannot see daylight, they often have sleep disorders. We can expect another significant move—one way or the other—on Thursday or Friday.
Only one of the four major biotech ETFs finished Tuesday’s session in the red. The SPDR S&P Biotech Index ETF (XBI) sank 1.16% to close at $118.96. XBI still remains 4.71% below its 50-day moving average of $124.85. The iShares Nasdaq Biotechnology Index ETF (IBB) finished in positive territory for the third consecutive day with a 0.36% advance to $206.29. The Market Vectors Biotech ETF (BBH) rose 0.15% to finish at $80.67. The First Trust NYSEARCA Biotechnology Index ETF (FBT) climbed 0.30% to end the day at $63.99.
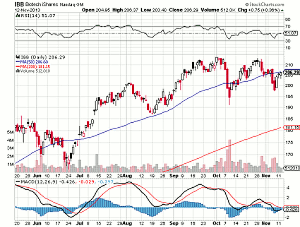
The chart below depicts the performance of the iShares Nasdaq Biotechnology Index ETF (IBB) during the past six months.

(Chart courtesy of Stockcharts.com)
Click to Enlarge
As the chart demonstrates, IBB had not even made contact with its 50-day moving average from June 28 until the October 8 stock market swoon, when it crossed below the 50-day moving average. From October 10-16 IBB was stuck hovering around the 50-day MA. From there, IBB worked its way into a head-and-shoulders pattern, which usually signals a further decline. Nevertheless, from Friday through Tuesday, IBB as climbed as far as being right on the verge of breaking the neckline and defeating the pattern. It will probably be necessary for this ETF to close above its 50-day moving average of $206.60 to break the neckline. Tuesday’s closing price was 31 cents short of that goal.
The relative strength index for IBB is 51.07. The MACD is on an ascending trajectory, just below both the signal line and the zero line. Crossing both of those will signal the likelihood of a continued advance during the immediate future.
The major ETFs, which responded to developments in the technology sector on Tuesday were:
Technology Select Sector SPDR ETF (XLK): +0.27%
Vanguard Information Technology Index ETF (VGT): +0.44%
iShares Dow Jones U.S. Technology Sector Index ETF (IYW): +0.39%
Market Vectors Semiconductor ETF (SMH): +0.52%
iShares PHLX SOXX Semiconductor Sector ETF (SOXX): +0.62%
By John Burke of Wall Street Sector Selector


