

This tech giant recently hit a $400-per-share high but has since pulled back, so technician Corey Rosenbloom of AfraidToTrade.com examines the technical evidence for signs on whether it will resume its uptrend or retrace even further.
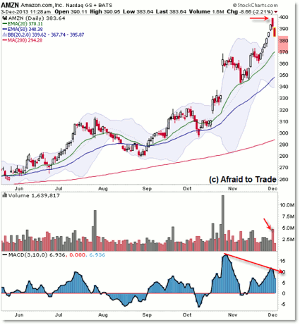
Strongly trending stock Amazon.com (AMZN) is currently pulling back in retracement mode after six straight days of upside gains.
Let’s take a look at the current pullback, note key target levels, and plan for contingencies if the strong trend resumes before downside trading targets are achieved.
In the context of pro-trending stocks, especially those “strong and getting stronger,” we typically look to put on positions (buy) on pullbacks to rising trend lines, moving averages, or even Fibonacci retracements (for advanced traders).
Click to Enlarge
Right now, Amazon.com shares are pulling back or retracing down from the recently achieved $400 per share high, and they’ve done so on a gap-up and reversal intraday pattern from the “round number” target level.
A simple glance at the daily chart shows us that a logical first downside support target would be the confluence of the November swing high (note red reversal candles) into the rising 20-day EMA overlapping $370 per share.
A failure (breakdown) under $370 per share suggests a deeper pullback may continue toward $350 (let’s not get ahead of ourselves yet).
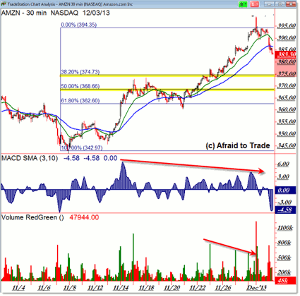
We can drop the perspective to the intraday chart for more detail in strategy planning:
Click to Enlarge
We look to the intraday or lower frame chart to see additional details—and potential “overlap” of indicators/target levels—that we can’t see on the daily chart.
The main focal point of the daily chart is the $370 per share target level, we see one more potential support target, which is near $375 or the 38.2% Fibonacci retracement.
While not guaranteed, it would be logical to see a pullback to the confluence (overlap) of the 50% or “halfway” Fibonacci retracement into $370, which develops into the mid-November high and the 20-day EMA.
Amazon.com (AMZN) shares would generally be expected to trade logically into the $5 zone between $370 and $375.
A failure for this logical outcome to happen—meaning buyers step in ahead of these targets to continue the uptrend—would suggest additional strength yet to come (targeting a breakout above $400).
A deeper pullback and breakdown under $370 would send the opposite trading (supply/demand) message, arguing for a potential downside play toward $350.
Continue updating your charts and monitoring price action toward these levels.
By Corey Rosen bloom, CMT, Trader and Blogger, AfraidToTrade.com


