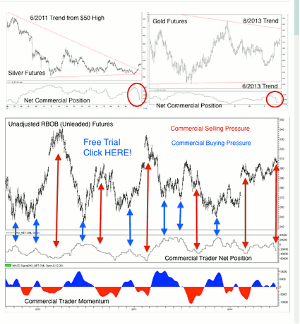
Andy Waldock of Commodity & Derivative Advisors thinks the gold and silver markets are displaying a classic example of the interaction between commercial and retail traders and offers this advice for those wondering whether or not now is the time to buy into the metals.
Gold and silver have both traded higher since early June. We began noting the commercial traders' accumulation in the gold market back towards the end of April. As usual, the market had one more move left in it before confirming its bottom. Just as we suggested that retail traders were likely to be forced out by one more flush due to some index selling triggering small stop loss order running. This is the typical capitulation pattern in the futures markets.
Gold has rallied more than 7% over the last month and silver has climbed nearly 14% in the same time frame. This rally has pushed the market towards some important technical levels. The question I've been asked the most is, "Should I buy the metals, now?"
The short answer is, "no." The gold and silver markets are displaying a classic example of the interaction between commercial and retail traders. Another way to look at this is the battle between professional and amateur traders. No different than a poker game, the pros know how to flush out the weak hands and collect the pot on the table. That being said, the commercial traders' actions are easily tracked through the weekly Commodity Futures Trading Commission's Commitment of Traders Report. Tracking the commercial traders’ net position allows us to view their consensus of the market across time and price.
We track their actions in two ways. First of all, we track their net total position. This allows us to compare their current position sizes to historical norms, thus determining their approximate total buying or selling capacity, which then tells us how much more buying or selling pressure they may have to unleash. Secondly, we track the momentum of the net change in their position. This allows us to determine how anxious they are to get their positions executed at a given market price regardless of whether their net position is bullish or bearish. We trade inline with the commercial traders' momentum. We are more concerned with their current degree of interest in a market and its corresponding price than we are with the total net position over the long run.
The argument between inflation and deflation rages on with each side making valid points. The advantage of following the commercial trader category is that it allows us to put the research and analysis of the commercial traders' brainpower and models to work for ourselves. Ultimately, consensus is the last traded price. In this case, it is clear that they are putting their money on deflation. Commercial traders have sold nearly 70,000 gold contracts in the last two weeks with more than 50,000 sold just last week. Commercial traders haven't sold this many contracts in one week since September of 2009. This isn't reading the tea-leaves, this is purely quantitative. The same general pattern holds true for silver. Commercial traders have sold more than 33,000 contracts in the last three weeks with more than 20,000 sold just last week. Last week's selling was the most aggressive commercial selling in the silver futures since July of 2003.
NEXT PAGE: Technical Analysis, Anyone?
|pagebreak|Moving from the fundamental analysis of the commercial traders and into the technical analysis provided by the charts lends further credence to the commercial traders' selling. Gold and silver have both been trading sideways for the last two years. The ranges have become tighter and tighter as these markets press up against their trend lines drawn from the highs of years' past. I've plotted them along with the commercial position on this chart.
Gold has remained a bit stronger than silver over the last two years. Therefore, the gold trend lines are drawn from the 2013 highs and lows respectively. Silver recently closed above its trend line dating back to its $50 high in April of 2011 on June 18th and rocketed higher on June 19th. Meanwhile, gold has yet to push through its more horizontal trend line from 2013's high and now comes in as resistance around $1,365.
Gold and silver still face substantial resistance after years of sideways action. Gold resistance comes in initially around $1,330, then the trend line at $1,365, followed by March's high just short of $1,400. Silver, which has pushed through its major trend line, now finds resistance at $22.25 and then, $23.10. Given the tremendous amount of selling pressure by the commercial traders, along with strong overhead technical resistance, we feel the odds are better looking at the short side of these markets. Commercial traders are value traders and the farther above or below value a market gets, the more aggressive their trading becomes. Clearly, the largest net sales in years are a good indication of their anxiousness to hedge their future production at these prices. Finally, for those unwilling to short the market, I would suggest at least waiting until the commercial traders start covering these short positions before I'd be willing to buy in.
By Andy Waldock, Founder, Commodity & Derivative Advisors


