

Ryan Mallory, of SharePlanner.com, shares his technical outlook for the S&P 500 based on last week’s price action. Given the massive head and shoulders pattern he saw forming on the 30-minute chart dating back to mid-February, Ryan also offers a list of trades he closed out.
Technical Outlook (SPX):
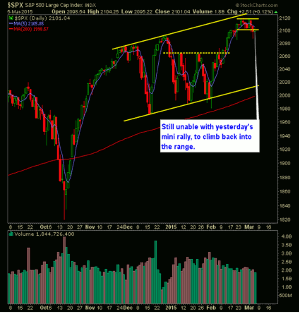
- Very small rally that saw the bulls unable to push price back into the price range between 2103 and 2117.
- Massive—and I do mean massive—head and shoulders pattern forming on the 30-minute SPX chart dating back to mid-February.
- Some support seems to be found on the daily chart of SPX at the 20-day moving average.
- The moving average will be tested right out of the gate Friday morning with the weakness seen in futures following the employment report.
- Often times, the best of news marks tops in an aging, upward trend.
- VIX dropped 1.3% Thursday to close at 14.04.
- T2108 showed further deterioration in the % of stocks trading above their 40-day moving average. Currently at 60%.
- Volume on Thursday's rally was very weak.
- If the market goes down Friday, look for possible support at 2088.
- SPX needs to at least get back into the short-term trading range, which is above 2103, and ideally back above 2117.
- Oil remains extremely volatile and becoming more so each and every day. Very difficult to trade, as are the oil stocks.
- The market doesn't care about the economy nor earnings. That is not what is driving it.
- The market only cares about what the Fed is doing to keep equities propped up.
My Trades:
- Did not add any new positions Thursday.
- Closed out AAPL Thursday for a 1.7% loss.
- 20% Long / 10% Short / 70% cash.
- Remain long DD at 77.19, VMW at 85.73.
- Remain long SPXU at 35.30.
Chart for SPX:
Click to Enlarge
By Ryan Mallory, Founder, SharePlanner.com


