

In his Emini weekly update, the Trump rally is leading to a correction, asserts Al Brooks, MD, who has traded full-time for 30 years and is the author of several books, in his weekly commentary.
Monthly S&P500 Emini futures candlestick chart:
Trump rally to new all-time high leading to correction
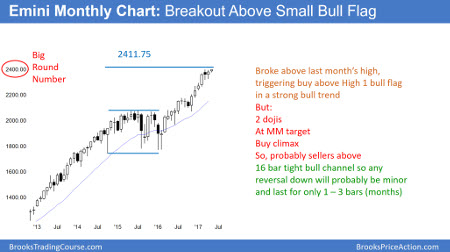
The monthly S&P500 Emini futures candlestick chart had a bull inside bar last month. It is therefore a buy signal bar in a strong bull trend. The bulls triggered the buy signal by breaking above the April high.
The monthly S&P500 Emini futures candlestick chart is in a 17-month strong bull trend. Because last month was a bull inside bar, it is a buy signal bar. Since the 17-month rally is in a tight bull channel, it is strong. The bulls triggered the buy signal at the end of Friday (May 5) by rallying above the April high.
But, this High 1 bull flag is at the top of a 6-month buy climax. Furthermore, it is at a measured move up from a 2-year trading range. The breakout above a High 1 bull flag at resistance and after a buy climax usually fails. As a result, there are probably more sellers than buyers above the April high.
Consequently, the breakout will probably reverse down into a 2 to 3-month bull flag within a month or two. Because the 17-month bull channel is tight, bulls will buy the first reversal down. Hence, a 2 to 3-month selloff will probably become a bull flag and not a bear trend.
Yet, after the Emini rallies up from that bull flag, the bears will try to create a micro double top with the top of the current rally. If they succeed, they would have a higher probability of creating a major reversal down at that point.
Final Bull Flag
The 2014 – 2015 trading range is late in an 8-year bull trend. Hence, it will probably be the final bull flag. Therefore, the upside from here is probably limited to 100 points or so before the Emini reverses back to the 1,800 bottom of that final flag.
That major reversal down will probably need at least a micro double top. Since that would take at least a few months to appear, the downside risk over the next several months is probably about 150 points and a few months. Hence, a pullback into a bull flag over the next few months is more likely than a reversal into a bear trend.
There is no major top yet. Furthermore, the top might take 10 or more bars to complete. Consequently, the bears might need 2 to 3 years before they can test down to the 1,800 level.
Weekly S&P500 Emini futures candlestick chart:
Unusually extreme buy climax, but no top yet
The weekly S&P500 Emini futures candlestick chart formed a small bull trend bar this week (ending May 5). This is after last week’s gap up. This week was the 25th consecutive week completely above the 20-week exponential moving average (EMA).
The weekly S&P500 Emini futures candlestick chart has been above is moving average for 24 weeks. This has happened only twice in the 8-year bull trend. Early in the trend, it stayed above for 27 weeks, and then again for 26 weeks. The reversal down to the moving average began around the 24th week in both cases.
Since trends tend to weaken as they age, the current rally will probably not be stronger than the 2 earlier ones. In the 19-year history of the Emini, the weekly chart stayed above its average for more than 27 weeks only once. That was in 2003 when it stayed above for 51 weeks. Yet, it got very close to the average on the 17th and 25th weeks. That relieved the overbought condition and allowed for the trend up to resume.
The March and April lows this year did not get close enough to the average price to relieve the overbought situation. Hence, there is a 70% chance that the Emini will begin to reverse down to the weekly moving average within the next few weeks. There is only a 30% chance that the current strong rally will continue for more than a few weeks before pulling back.
Perfect trade
Perfect trades cannot exist. A perfect trade has a high probability of a big reward while risking very little. All trades are a combination of probability and risk/reward.
If one side gets good probability, the other side gets good risk/reward. For a trade to take place, there has to be a reason for both the buyer and seller to trade. Therefore, a trade that is perfectly good for one side is perfectly bad for the other. No one would take a perfectly bad trade. This is one where there is a low probability of a profit, and the profit is tiny compared to the risk.
While perfect trades cannot exist, unusually good ones can. This is the current situation on the weekly chart. There is a 70% chance of a 100 points selloff before the Emini goes 50 points higher. Hence, the probability is high that a trader can make a reward that is at least twice his risk.
Good time to buy puts or put spreads
This buy climax is very unusual, and therefore buying June or July puts or put spreads is a good trade. Traders should wait to see if the breakout stalls next week.
The risk is the cost of the options, and the reward is at least twice the size of the cost. If a rally lasted more than a few weeks, traders could exit before losing the entire cost of their options.
Hence, the actual risk is less that the cost of the puts. Furthermore, if the Emini fell 150 points or more, the reward could be more than 2 times the cost of the options.
Possible island top
The Emini closed at its all-time high. Hence, it could gap up again the week ending May 13. If the Emini gaps down on Monday to below the low of this past week, it would create a gap down on the weekly chart. Since the weekly chart gapped up 2 weeks ago, the gap down would create an island top.
While most island tops and bottoms lead to legs in a trading range, they sometimes lead to trends. Because a swing down is likely over the next couple of months, a big gap down on Monday could be the start of the correction. This would be more likely if Monday gapped down and formed a big bear trend bar.
Furthermore, the probability would go up if this week gapped down and the week was a big bear bar on the weekly chart. Additionally, the bears would need follow-through selling over the following days to convince traders that a correction was underway.
Yet, unless the Emini breaks below the March 27 bottom of the 2-month trading range, traders will assume that any selloff was just another bear leg in the range. Since that low is the neck line of the 2-month double top, a break below could lead to a measured move down. That would therefore result in a test of last year’s close.
Last year’s close
The Trump rally began in November. A measured move up from the November low to the December close is 2,396.75. The March 1 all-time high and Friday’s high (May 5) was 2398.00. It was therefore very close to the target.
Whenever a market stops at a target, it is telling traders that the prices that led to the target are important. Consequently, the December close is important. Yet, the Emini never pulled back to test this important price. Therefore, if the Emini pulls back to below the weekly moving average, there is a 50% chance that the selloff will continue down to the December close.
Since the monthly chart is in a strong bull trend, the monthly bulls will buy a deep pullback. A test of the December close would be a 50% pullback from the Trump rally and a therefore a logical price for the bulls to buy again.
Daily S&P500 Emini futures candlestick chart:
Breakout above bull flag
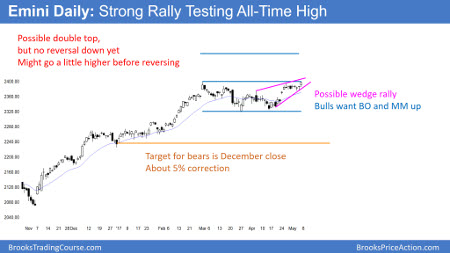
The daily S&P500 Emini futures candlestick chart broke above a High 2 bull flag on Thursday (May 4). Friday rallied strongly and reached the all-time high exactly to the tick.
The daily S&P500 Emini futures candlestick chart has rallied for several weeks. Yet, because of the unusual buy climax on the weekly chart, the bears will look for a sell setup. The momentum up is strong and there is no top yet. The odds favor higher prices, although the bears hope for a reversal down from the current perfect double top.
If the Emini reverses down from where it is now, it would have to be a perfect double top with the March high. Because the momentum up is strong, the Emini will probably trade above the March high and above 2,400 next week. If so, the bears might create a wedge top, where the April 5 and April 26 highs were the 1st 2 pushes up. A reversal down would then be a wedge higher high major trend reversal.
Since most tops fail, picking the exact one is a low probability bet. Yet, the odds are high that the Emini will begin a 100 to 150 correction within a few weeks. Therefore, traders should be prepared for a swing down that could last a couple of months. If one develops, there will be several strong bear trend days. Day traders should therefore be ready to swing trade their shorts during those days.
The bull case
The Emini has been in a strong bull trend for 8 years. Yet, the weekly chart has an unusual buy climax. Hence, there is a 70% chance of a correction beginning within a few weeks. However, that means that there is a 30% chance that the current rally could last many more months without a 5% correction. The odds for the bulls reaching 2,500 without the correction will go up if they can get a strong rally from here that lasts more than 3 weeks.
Summary: 2% up over 3 weeks, then 5% down over 2 months
The momentum up is strong on all time frames and there is no top yet. Traders will continue to buy. Yet, the weekly buy climax is extreme by historical standards. Therefore, the odds are against the rally lasting more than a few weeks. Since the momentum up is strong, the rally might continue for another 1 – 2% over the next 3 weeks. The pullback on the monthly chart should last 2 – 3 bars, which is 2 – 3 months. The selloff should go below the weekly moving average, which means about 100 to 150 points, and about 5%.
Since the weekly and monthly trends are so strong, bulls will buy the pullback. Consequently, the best the bears will likely get over the next 3 to 6 months is a 150-point pullback and then a trading range. Once there is a trading range, they then will have a better chance of a major reversal. But, because most reversals fail, the odds continue to favor the bulls indefinitely until there is a strong reversal down with strong follow-through.


