

The monthly S&P500 Emini futures candlestick chart has not had a pullback in 14 months. This has never happened in the history of the stock market. That makes this rally extreme and unsustainable. Hence, it is a buy climax, asserts Al Brooks.
Monthly S&P500 Emini Futures Candlestick Chart:
Strong bull trend, but unsustainable and therefore a buy climax
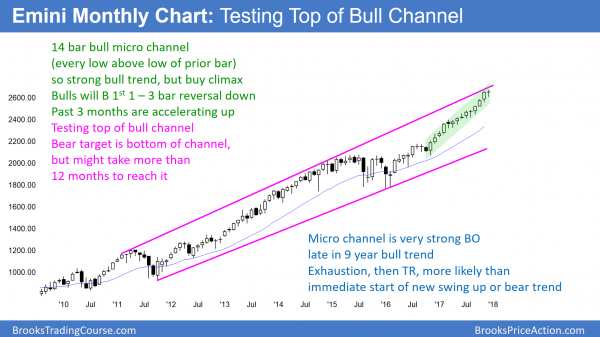
After 3 big bull bars, this month so far is a doji bar. Its low is above last month’s low. This is the 14th month without a pullback. Additionally, the monthly S&P500 Emini futures candlestick chart is now at the top of a 9-year bull channel.
The monthly S&P500 Emini futures candlestick chart has not had a pullback in 14 months. This has never happened in the history of the stock market. That makes this rally extreme and unsustainable.
Hence, it is a buy climax. The odds are that this month will fall below last month’s low or next month will fall below this month’s low. If this month remains as a doji bar or becomes a bear bar, the odds of a pullback within the next 1 – 2 months will be 70%.
While the 14 bar bull micro channel is a buy climax, it is also a sign of very strong bulls. They are buying at the market and not even waiting for a pullback before buying. Consequently, once they finally an opportunity to buy below the low of the prior month, they will probably eagerly do so.
Therefore, the odds are that the first pullback to below the low of the prior month will be brief. Hence, it will likely be only a 1 – 3 bar bull flag. The odds of a reversal down into a bear trend when there has not been even a micro double top are only 20%.
Top of 9-year bull channel
While 75% of breakout attempts above or below channels fail, this 22-month bull leg in the 9-year bull channel has been in a very tight bull channel. Consequently, a strong reversal down from the top of the 9-year channel is unlikely without the monthly chart forming at least a micro double top. That means that the downside risk is small for at least several months.
In addition, when a channel has been as strong as this 22-month leg has been, the Emini usually has to go sideways for 5 – 10 bars before the bears have a reasonable chance of a reversal down to the bottom of the 9-year channel. That means that the downside risk over the next year is also small. It is more likely that the best the bears will get over the next year is a trading range, not a strong reversal down.
First pullback will be about 100 points
Since the monthly bars have been 70 or more points tall, a pullback to below the prior month’s low will be at least 70 points. It probably will fall more than a few ticks below.
Therefore, the first pullback will likely be about 100 points. While that would be a bear trend on the daily chart, it would only be a bull flag on the monthly chart. A bull flag means that a resumption of the bull trend is more likely than a reversal into a bear trend.
Weekly S&P500 Emini futures candlestick chart:
Parabolic buy climax
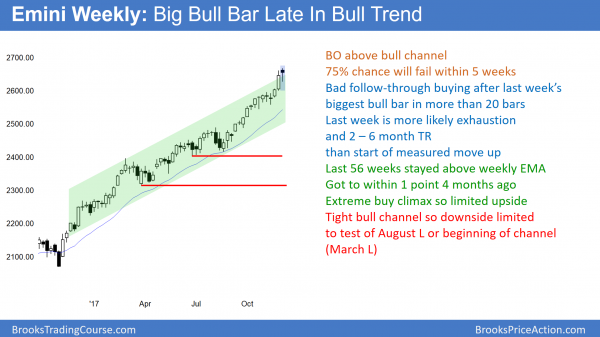
The weekly S&P500 Emini futures candlestick chart has not touched the 20-week exponential moving average in 56 weeks. The week is a weak follow-through bar after last week’s big bull bar.
The weekly S&P500 Emini futures candlestick chart is in a strong bull trend. The week of Dec. 4 was not a big bull trend bar. Hence, it is bad follow-through after the previous week’s big bull trend bar. Because the previous week was the biggest bull bar in more than 20 weeks, it is more likely an exhaustion move than the start of a new, stronger leg up.
Yet, a buy climax bar often has one more strong bull bar before the Emini enters a trading range. Therefore, the week of Dec. 11 might be another big bull trend bar. However, the odds are that the bull breakout would soon fail.
An exhausted buy climax usually stops going up, and it sometimes reverses down. However, when the rally is in a tight bull channel like this one, the reversal usually goes mostly sideways to down for 5 – 10 bars. The odds of a strong bull trend immediately reversing into a strong bear trend are small. Consequently, the best the bears can probably get over the next few weeks is a trading range.
Suppose there is a 5% correction?
Even if the monthly chart pulls back below the prior month’s low and the selloff is 100 points or about 5%, the bulls who trade the weekly chart will buy it. This is because if the selloff is part of a new trading range, it will lead to a test back up to the top of the range.
They will make money if they scale in lower (buy more). If instead, it is a small bull flag, the bull trend will resume, and they also will make money.
Daily S&P500 Emini futures candlestick chart:
Tax plan, budget votes threatening Trump’s stock market rally
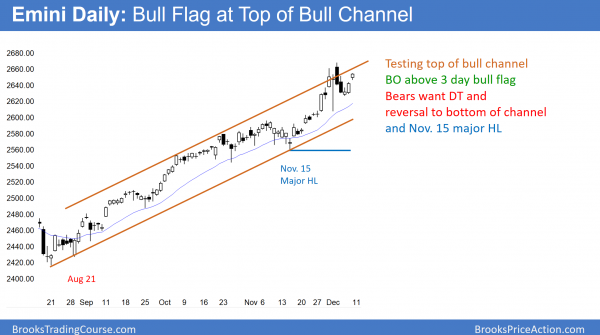
The daily S&P500 Emini futures candlestick chart is beginning to go sideways after a buy climax.
The daily S&P500 Emini futures candlestick chart has had big moves up and down over the past 2 weeks. This is a sign that the bulls are getting quicker to take profits and the bears are getting more aggressive.
However, trends constantly try to reverse, and my 80% rule says that 80% of reversal attempts fail. Consequently, even though a 100 point selloff is likely within the next few months, betting that a particular top will be the final top is a losing strategy. Look back over the past 6 months, there have been many reasonable tops and many strong bear reversals. Each was only a pullback and it led to a new high.
Since the monthly, weekly, and daily charts have never all been this overbought, the odds of a 5% correction over the next several months are probably 70%. However, until the daily chart has consecutive big bear bars, the odds continue to favor at least slightly higher prices.
Longest streak without 3% correction
The daily chart has now not had a 3% correction in 268 trading days and 402 calendar days. This is by far the longest streak in the history of the stock market.
There never has to be a 3% correction. However, there will be one. In fact, at some point over the next 20 years, there will be a 50% correction.
Because charts are a reflection of rational human behavior, patterns repeat. Consequently, the Emini’s price action will soon have a regression back to its mean behavior. This means it will soon begin to behave as it has always done and get its 3% correction.
Since a pullback below the low of a prior month is likely, the correction will probably be more like 100 points and 5%.
Can it be 20%? When a buy climax is as extreme as this one has been, there is always an increased chance of a very big and fast reversal, like in 1987.
However, the chance of it is small. If there is some shocking news event, it could happen, but things like that happen only once every 10 years. It’s always easier to make money betting on things that are likely to happen. Betting on a 20% correction at the moment is a low probability bet. Most likely, the Emini will begin to pull back within the next couple of months and the bulls will buy again about 100 points down.
Watch Al Brooks discuss how to trade common patterns that form during the first hour in his talk at the recent TradersExpo Las Vegas here
Traders can see the end of the day bar-by-bar price action report by signing up for free at BrooksPriceAction.com.


