

Markets are now in their Santa phase. Expect rallies with brief interruptions for consolidation or profit taking. It is a little surprising they can’t even string together a serious shake of the trees, says Jeff Greenblatt, editor of The Fibonacci Forecaster.
Lately, it has been very hard to be a bull in precious metals. Not only has economic news improved, but the crowd seems to have fallen in love with a new entity which appears to be taking the shine off gold and silver. But we might have a teaching moment when it comes to a possible reversal.
If you’ve been paying attention to precious metals, you know they’ve been hit hard during this sequence where tax reform has taken center stage.
The tax package is less than many hoped for, but the consensus seems to be it is a step in the right direction.
Cryptocurrencies also seem to be diverting investment funds to the shiny metals.
Lately, bitcoin (BTC) seems to have all the characteristics of a bubble as it has gone crazy in the past two weeks. Briefly, I think it is a bubble as well but likely has a chance to mature.
Serious market historians know technological advancement can lead to manias as it did for the rails in the 1840s and appliances in the 1920s. Each recovered but it took 40 years for the rails and 25 years for Dow Jones Industrials (DJI) to get back to 1929 levels. Recent history shows 15 years for the NASDAQ to recover the top while Amazon (AMZN) is one of the survivors. The verdict is bitcoin is likely to go through a painful period as well but the trust issue with central banks suggests people are going to want these currencies.
What's behind the bitcoin bonanza? And what should you do about it?
The Silver chart has absorbed any number of technical violations recently but this one has a chance. As you know we’ve discussed how retracements can be just about any number.
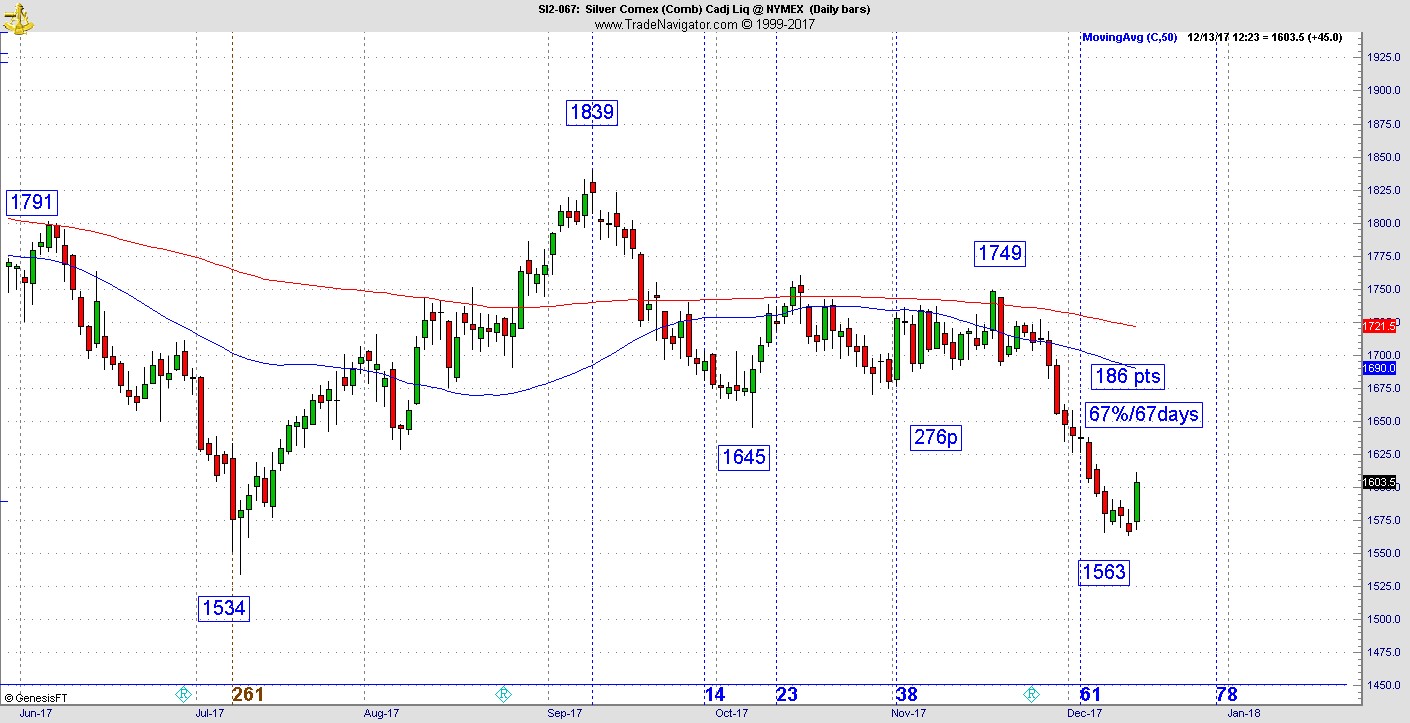
Traditional Fibonacci/Elliott analysis also looks at pure golden spiral 61/161 relationships. One popular tendency is to look at the last leg to the bottom, just as you would in Elliott where traditional C waves are either .618 or 1.618 of the first leg or the range. Here we have a last leg of 186 points where the entire range is 276 points for the continuation Silver chart. Take that last push of 186 and divide into the range and we get 67%.
Now go from the high and the turn is also 67 trading days. If it lines up and reacts, it must be taken seriously just as we are observing right now.
What to do with this? If you are short, it is time to lock in profits. If you want to go long, keep on the lookout for a secondary low on an intraday chart like an hourly or 30 minute. Calling tops or bottoms is not the higher probability outcome.
Remember you can be a hero or make money, chances are you won’t do both. Even with a good Kairos moment here on this calculation, it can retest the low and give you indigestion. We can all attest to the fact sitting through retests of tops and bottoms are not fun. But catching secondary pivots generally lead to the best part of the move.
Briefly, markets are now in their Santa phase. Expect rallies with brief interruptions for consolidation or profit taking. It is a little surprising they can’t even string together a serious shake of the trees.
In the last important Fed meeting with Yellen in charge, they raised rates as expected. For the most part the initial indication was bullish. While there isn’t much to pour cold water on right now, it’s always wise not to get complacent and don’t go to sleep at the wheel.
Just when it looks like there will be a free pass is the time markets tend to interrupt the pattern.
Subscribe to Lucas Wave International newsletter here
Related series on trading bitcoin and cryptocurrencies on MoneyShow.com:
Getting your feet wet in cryptocurrency
How to trade cryptos safely
Do fundamentals drive bitcoin?
How to keep your cryptos safe


