

The odds favor at least a 100 point or 5% correction beginning within the next couple of months, asserts Al Brooks.
Monthly S&P500 Emini futures candlestick chart:
Strong bull trend
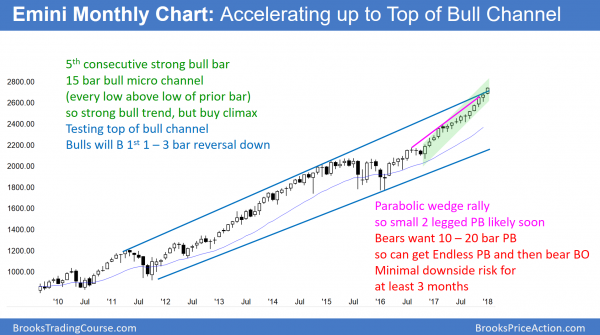
For the past 14 months, every bar on the monthly S&P500 Emini futures candlestick chart had a low above the low of the prior month. This is a very strong bull trend, but unsustainable and therefore climactic.
A bull micro channel is a series of bars where every low is at or above the low of the prior bar. This means that the trend does not have a pullback. The monthly S&P500 Emini futures candlestick chart now has a 15 bar bull micro channel. There has never been one this long in the 95-year history of the S&P cash index.
ecause this has never happened before, it is unsustainable and therefore climactic. Yet, a climax can extend for far more bars than what traders think is possible. Until there is a top, there is no top, and the odds continue to favor higher prices.
Because the bulls have been so eager to buy, they will be happy to finally have a chance to buy a pullback. Consequently, there are bulls looking to buy below last month’s low. In addition, the bears do not want to sell with stops below the low of the prior bar because they cannot even make money selling will limit orders above the high of the prior bar. As a result, the first time there is a pullback, it will probably be small and only last 1 – 3 months.
Even if it lasts 6 months and falls 20%, the bulls will still buy it. The selloff will still be minor, although big. The odds would still favor a test back up to the high before the bears would have a reasonable chance of creating a bear trend.
Weekly S&P500 Emini futures candlestick chart:
Big bull breakout
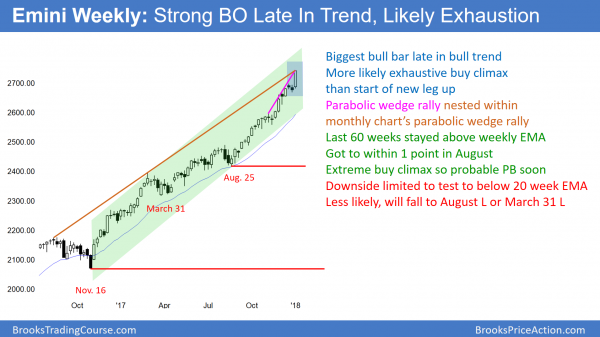
The weekly S&P500 Emini futures candlestick chart had a big bull trend bar this week. However, it is in a parabolic wedge rally since the August low.
The weekly S&P500 Emini futures candlestick chart had a big bull trend bar this week. But, it was the biggest bull bar late in a bull trend. It is more likely an exhaustive move than the start of a stronger leg up. Most exhaustion bars lead to a pause in the trend and not a reversal into an opposite trend. It was a big enough bar so traders expect slightly higher prices. Yet, the rally should stall within 1 – 3 weeks. There is often a pause bar and then one more climax bar before there is a 5 – 10 bar pullback.
This week is also the 3rd leg up in a tight bull channel that began in August. The rally is a parabolic wedge top. This makes about a 10 bar, 2 legged pullback likely to begin within a few weeks. Because the bull channel is tight with no big bear bars, the odds are that the pullback will be a bull flag. By a bull flag, I mean that the bull trend will be more likely to resume up than reverse down.
Less likely, the pullback will keep growing. If it lasts 20 bars, there would be a 40% chance of a bear break below the bull flag, and then a measured move down. Without that, there is a 70% chance that the 1st reversal down will lead to a new high. This is true even if the selloff is 10% and lasts 3 months.
What does a blow-off top look like?
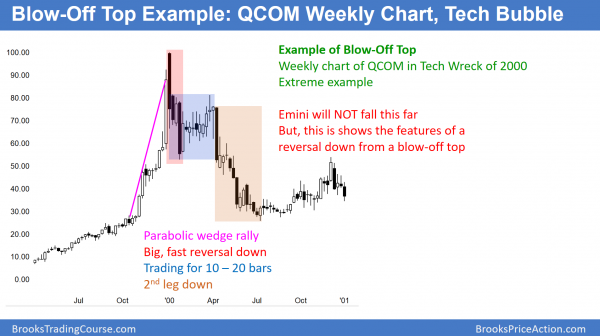
In 2000, many tech stocks rallied in parabolic wedge tops. These blow-off tops led to huge corrections. This weekly chart of QCOM is an example. The Emini will not fall this far. However, the chart shows the components of a blow-off top. There is a parabolic rally, a sudden, big reversal, a trading range, and then a 2nd, weaker leg down, but it can last a long time.
With the weekly chart of the Emini forming a parabolic wedge rally and a likely final buy climax, this is a good time to talk about blow-off tops. The Emini weekly chart looks like it might form a blow-off top. However, because the monthly chart is in a protracted bull micro channel, the reversal down on the weekly chart will be minor. It could quickly correct 5 – 10%, but the bulls will buy the selloff, unlike in the QCOM example above.
The Emini will likely have a relatively sharp initial selloff, followed by a trading range, and then a second leg down. However, the entire reversal will probably last only 2 – 3 months and not fall more than about 5%. The odds are that the bulls will buy the selloff and the Emini will be at a new all-time high within a few months.
Why do blow-off tops form?
These tops form because the weak bears who have been shorting repeatedly, believing the rally cannot go much higher, finally give up. They buy back their shorts at the market and don’t care that their loss will be huge. They cannot take the pain any longer.
The weak bulls who have been waiting for a pullback are afraid that one will never come. As the Emini accelerates up, they buy. This is a FOMO (fear of missing out) rally. With both the weak bulls and weak bears buying out of fear the market might go a lot higher, the market accelerates up.
At some point, the strong bulls are very happy about their sudden extreme profit. They use the rally to exit their longs that they bought from much lower. The strong bears know that a blow-off top and reversal are likely. They sell when the rally is at its most extreme. These are strong bears. They will never give up. In fact, they will sell more if the rally continues because they know the odds of a correction are high.
The strong bull bought months ago. When they exit, they are not looking to buy a few days later. They know that blow-off tops can lead to deep corrections.
onsequently, they wait for the correction to have 10 or more bars and at least 2 legs down. If the selloff does not look strong, the strong bulls will buy again, the strong bears will take profits on their shorts, and the rally will resume.
Daily S&P500 Emini futures candlestick chart:
Trump corporate tax cut rally might be January barometer
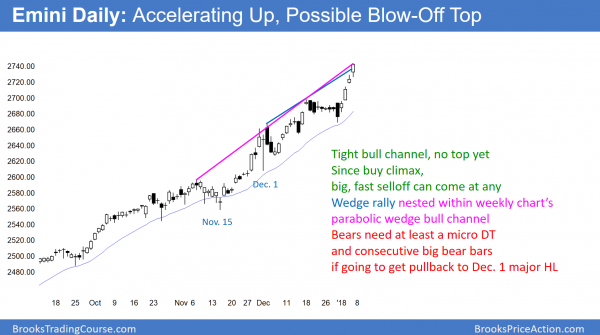
The daily S&P500 Emini futures candlestick chart has rallied strongly this week. It is testing the top of a wedge bull channel that began with the November 30 high, and the top of channel that began in August.
The daily S&P500 Emini futures candlestick chart is accelerating up to the top of a 3 month bull channel. While this rally is climactic, there is no top yet. The bears usually need at least a micro double top before they can get a 2 – 3 week reversal. Consequently, the best they probably can get over the next few days is a trading range.
On January 19, Congress votes on the budget. If they fail to pass or extend the budget, the government will run out of money. This would cause a sharp selloff. If they pass the budget, the Emini still might sell off because traders have such big profits that they might use the budget vote as an excuse to take profits. For example, if there is a 30 point rally after the budget vote, many bulls will think about taking profits.
Once the bulls who bought months ago decide to take profits, they are not going to look to buy again 3 days later. Instead, they will wait for at least 10 bars and 2 legs sideways to down. They would want to see how strong the bears will be. If the bears are unable to get a strong reversal within a few weeks, the bulls will buy again, expecting a new high.
Buy climaxes on the daily, weekly, and monthly charts
The Emini has been in existence for 20 years. There have never been buy climaxes this extreme on the daily, weekly, and monthly charts. Traders therefore need to look at the S&P500 cash index for comparisons. It was created in 1923, and the current buy climaxes are the most extreme in its history. The Dow Jones Industrial index (DJIA) started in 1896, and there have never been buy climaxes that are this extreme.
The monthly S&P500 cash index’s 15 bar bull micro channel is the longest in history. The 2nd longest was 13 months in 1995 and 1996.
The weekly chart has not touched its 20 week exponential moving average in 60 weeks. It got to within 2 ticks in August. The longest streak in history was 62 weeks in 1995 and 1996. Since the Emini and cash index are now far above their averages, it will take several weeks to get down to the averages.
In 1996, the top was at the 55th week and it took 7 weeks for the market to go sideways to down to the average. Consequently, the current streak will last longer. It is already the longest without the start of a pullback (remember, the 1996 pullback began at 55 weeks).
The daily chart has not had a 3% pullback in 430 calendar days and 296 trading days. This is by far the longest stretch in history.
While the stock market can continue to do something it has never done before, it probably cannot get much more extreme. Therefore, the odds favor at least a 100 point or 5% correction beginning within the next couple of months. The pullback in 1996 was 4.6%. This one will likely be similar.
January barometer
Every January, TV pundits like to talk about how the behavior in January, especially in early January, can predict how the year will end. I gave a list of these tendencies at the bottom of last weekend’s update. I believe they are useless to traders and are only for entertainment.
Watch Al Brooks discuss how to trade common patterns that form during the first hour in his talk at the recent TradersExpo Las Vegas here
Traders can see the end of the day bar-by-bar price action report by signing up for free at BrooksPriceAction.com.


