

This week starts with a “fragile-bounce” taking hold from Feb. 9, under highly-elevated levels of volatility and Bond yields. More from Ziad Jasani of the Independent Investor Institute, writing and videocasting on Monday.
Watch Ziad’s Market Strategy Video Session (recorded Monday, Feb. 12)
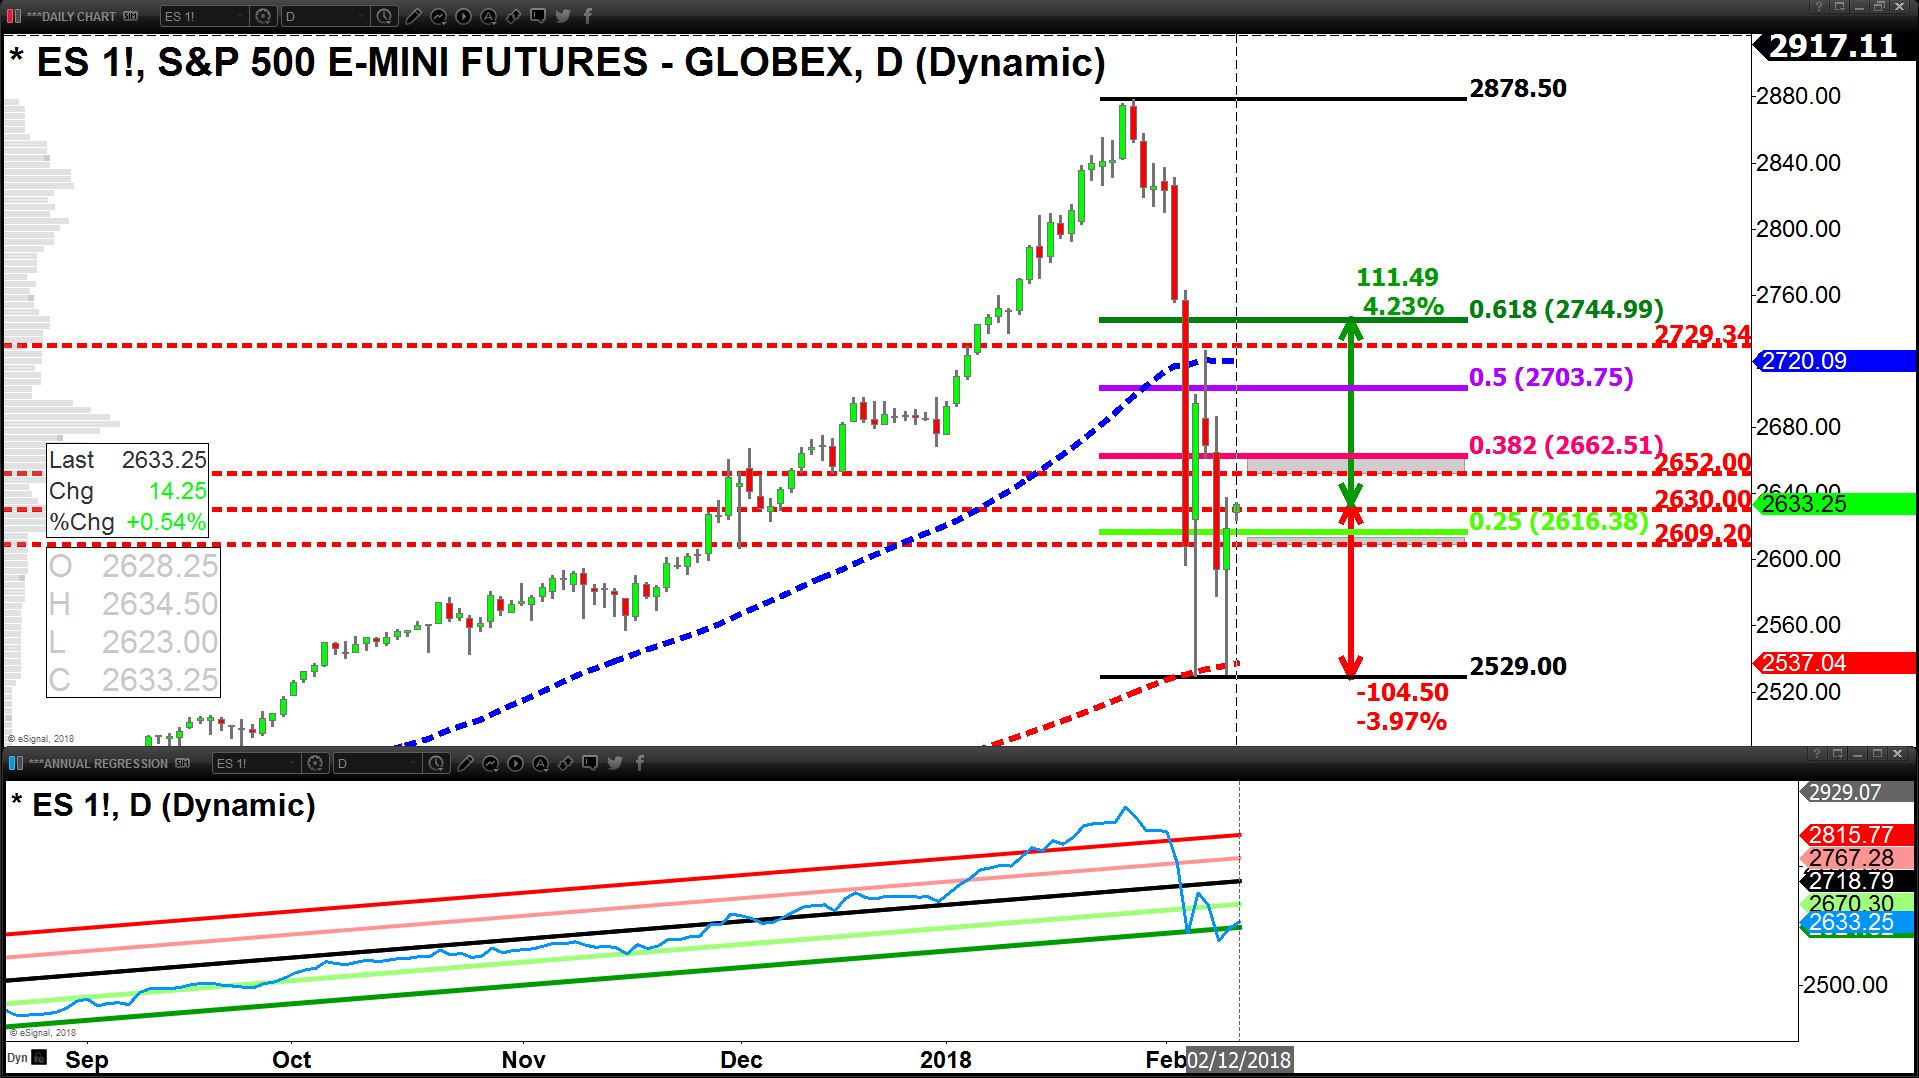
While the S&P 500 (E-Minis) remain above 2,609 the bounce can be considered intact. However, the next resistive structure that needs to be surpassed to add to positions picked up Feb. 9 is 2,664-2,652 (see chart).
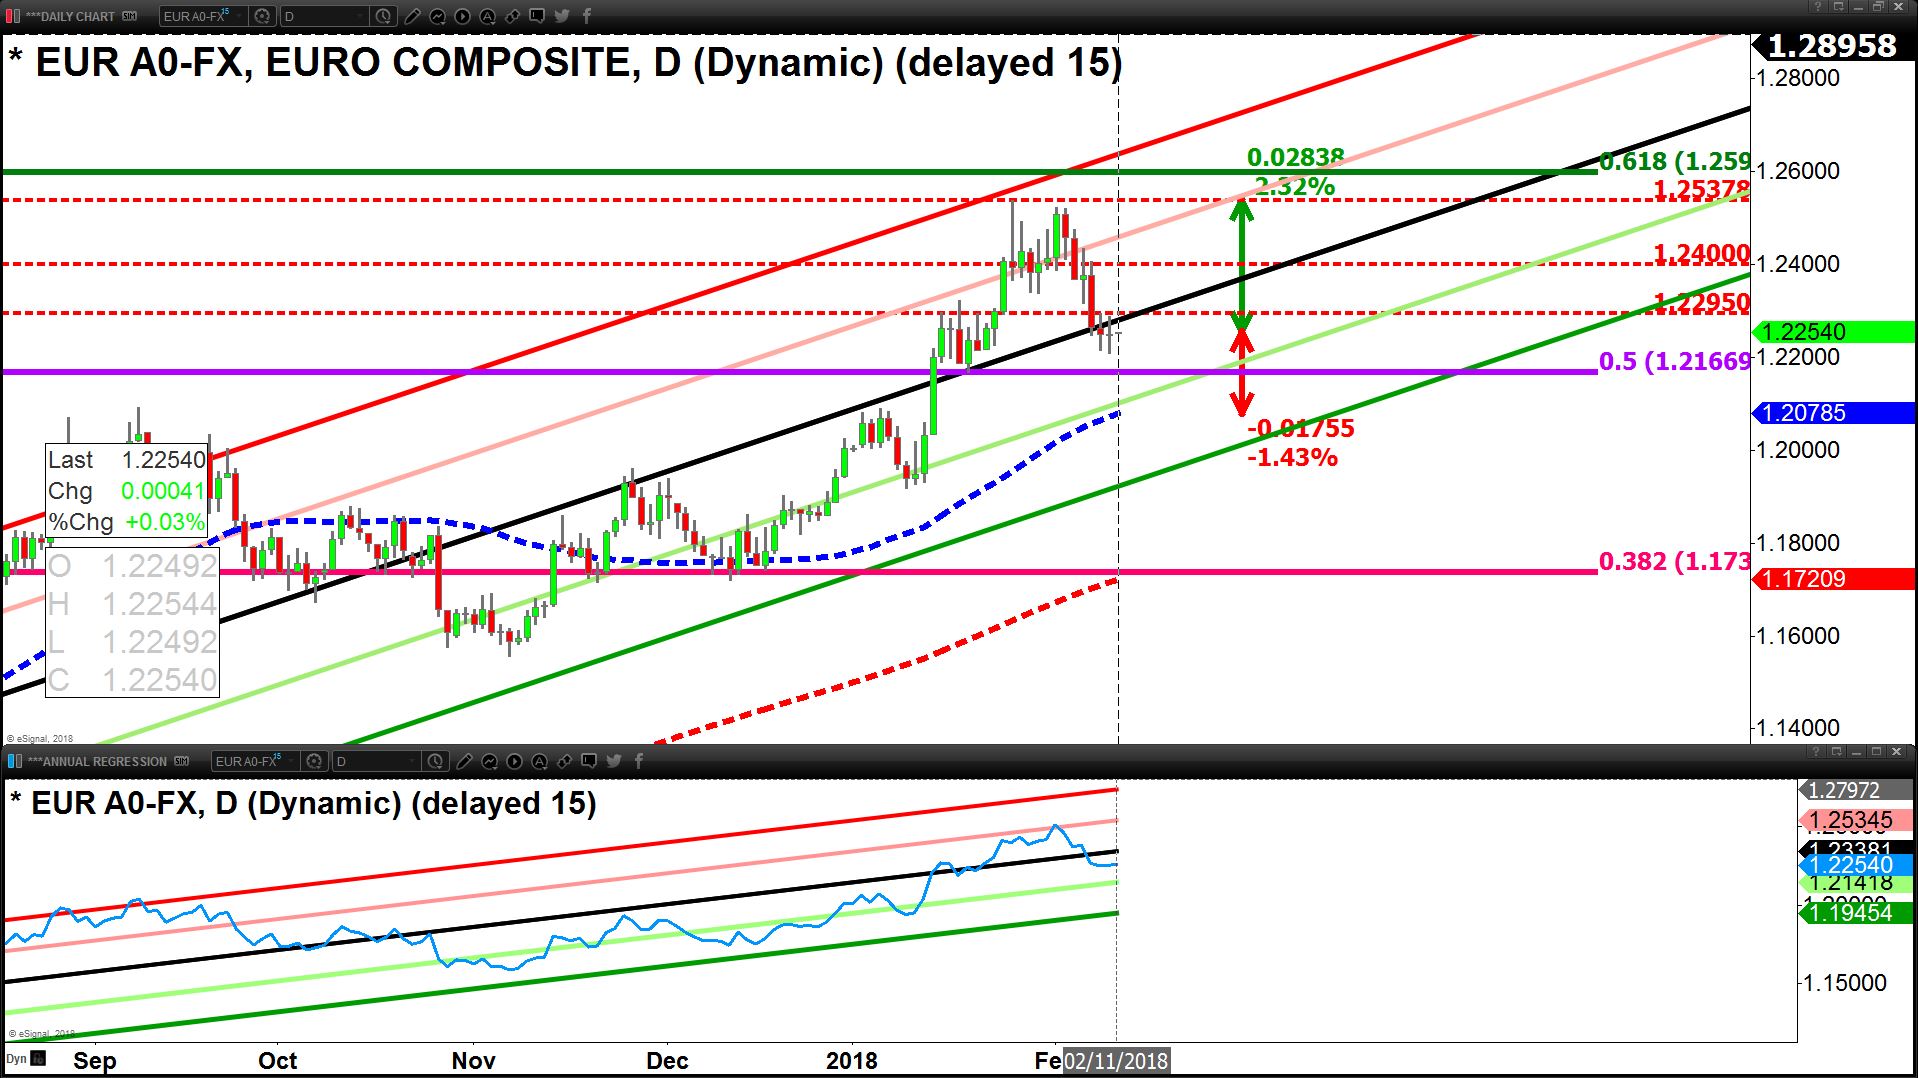
From Monday – Wednesday before 8:30 am (EST) we can expect the bounce to continue. However, on Wednesday we receive US Consumer-Price-Inflation (CPI). If this data-point beats consensus (+0.3% m/m), we can expect a stronger USD, and sharp drops in currencies on the other side (EUR, JPY, CAD, AUD), along with Precious Metals, Oil and Equities (vice-versa-on a miss of CPI).
Scenario A (Bullish):
- Feb. 9 bounce remains intact through Wednesday, Feb. 14 on a miss of US CPI
- Macro-Variable Behavior: USD ↓, Oil ↑, Gold ↑, Copper ↑, Bond Yields ↓, Bonds ↑, Global Equities ↑ (S&P 500 >2,715)
- Out-Performing Spaces: GLD, SLV, GDX, SIL, TLT, JNK, IWM, SPY, QQQ, DIA, DBC, DBB, XIC-T, XBI, XPH, XLE, RYE, XOP, XLB, XME, XLK, IYW, XLI, XLY, XFN-T, ZEB-T, XMA-T, XGD-T, XEG-T, ZEO-T, HMMJ-T, ACWX, EFA, FEZ, EEM (Hedged Canadian $ Denominated ETFs tracking Emerging Markets & Eurozone).
- Come-Along-For-The-Ride: Defensive Equity Sectors à XLU, XLP, VNQ, XLRE, IYZ, XST-T, BCE-T, XRE-T, ZUT-T
- What to do? If S&P 500 remains above 2,609 and the TSX above 15,025 to start the week we can nibble long further (aforementioned spaces), and add again when the S&P 500 is above 2,664 and TSX above 15,400.
Scenario B (Bearish):
- Feb.9 bounce fails on Wednesday, Feb. 14 US CPI beating consensus
- Macro-Variable Behavior: USD ↑, Oil ↓, Gold ↓, Copper ↓, Bond Yields ↑, Bonds ↓, Global Equities ↓ (S&P 500 < 2,715 on the path to re-test Feb. 9 lows 2,532; stronger move down on TSX)
- What to do? Traders: lower exposure into Wed 8:30 am (EST) and look short post beat of CPI (SH, SDS, PSQ, SQQQ, RWM, TZA, HXDT, HOD-T, DGLD, DSLV, DUST, JDST). Investors: trail with tight stops on everything picked up Feb. 9 or thereafter.
Why the US CPI data could beat consensus (+0.3% m/m):
- USD dropping sharply (-3.81%) from Dec. 2017 to end of Jan. 2018 implies an increase in the cost of goods consumed
- US trade deficit broadened in Dec. 2017 but stabilized in Jan. 2018.
- Oil remained > $62 for Jan. 2018.
Join experts at the Independent Investor Institute online for a complimentary deep dive on markets. The Live Session starts on Saturday, February 24, 2018, at 12 pm (EST) – 3 pm: Click here to register free


