

The stock market has a new line in the sand. This would not be apparent to the uninitiated so first let’s discuss why the market rallied over the past week. In going through this process, you will get a great example of how these square outs work, writes Jeff Greenblatt.
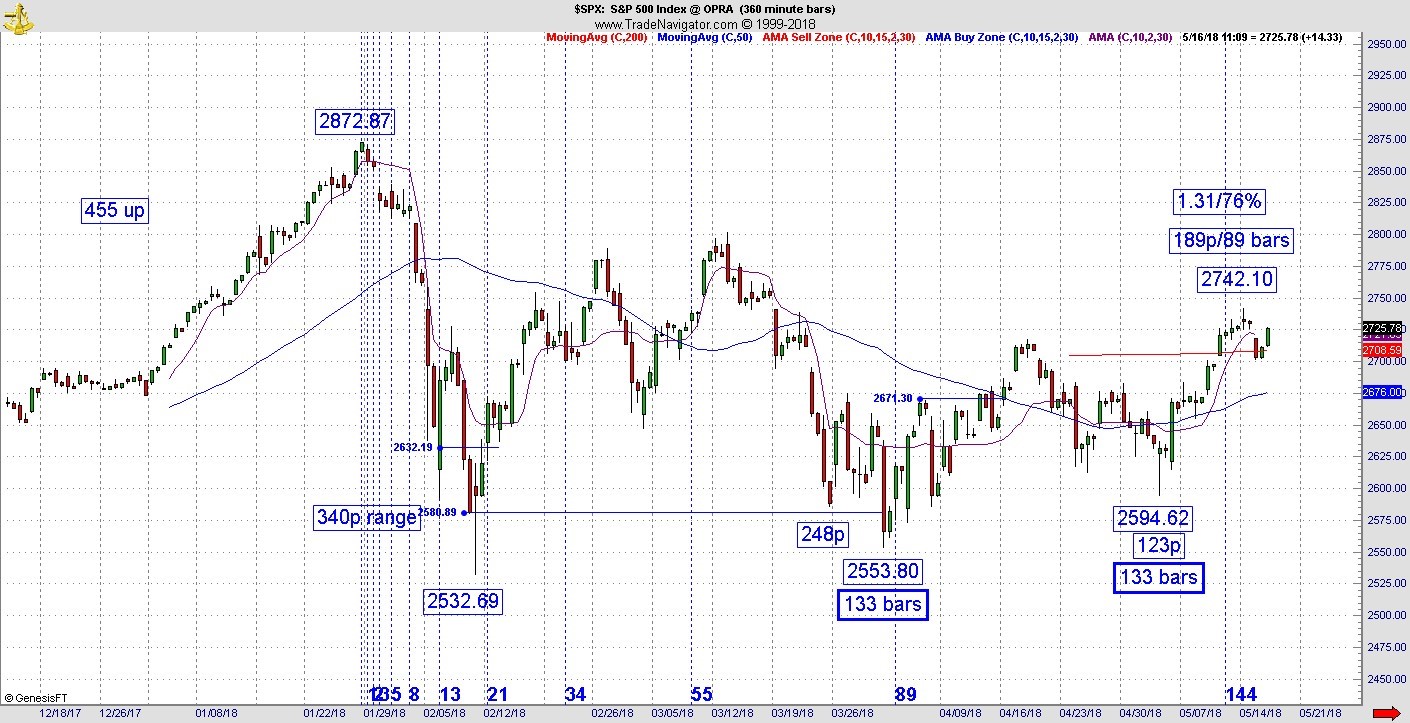
I must back up since I couldn’t be here last week. On May 3 the S&P 500 Index (SPX) fired off what Bill Williams from Trading Chaos fame calls a new bit of information. It found a secondary low at 133 bars off the top on a 360-minute chart after it already found a low at 133 bars on a 180 min chart on the same day the Dow Jones Industrials (DJI) found the low at 23344 in 44 trading days.
Why is 33 important? Simply because the first leg down was 340 points (Fibonacci 34 derivative) and the low came in at 2532.69 which rounds to 33. It set the stage for everything that has materialized since then. The stock market has been on a winning streak until Monday, May 14 as a result of these readings.
Given the lows have been defended very well, the bias for bearishness had to be adjusted. One of the biggest impediments to the success of the intermediate level trader is after having invested so much time in a belief, it’s tough to make that adjustment.
But one can be successful as a trader or be prideful, but chances are you won’t be both. That being said this is still a market dealing with tremendous geopolitical risk so it’s not prudent to be too invested psychologically either way at this point. One approach is to chunk out the territory.
If you know where the key support and resistance areas you may have to go through a new assessment of the market roughly once a week or every other week in an environment like this.
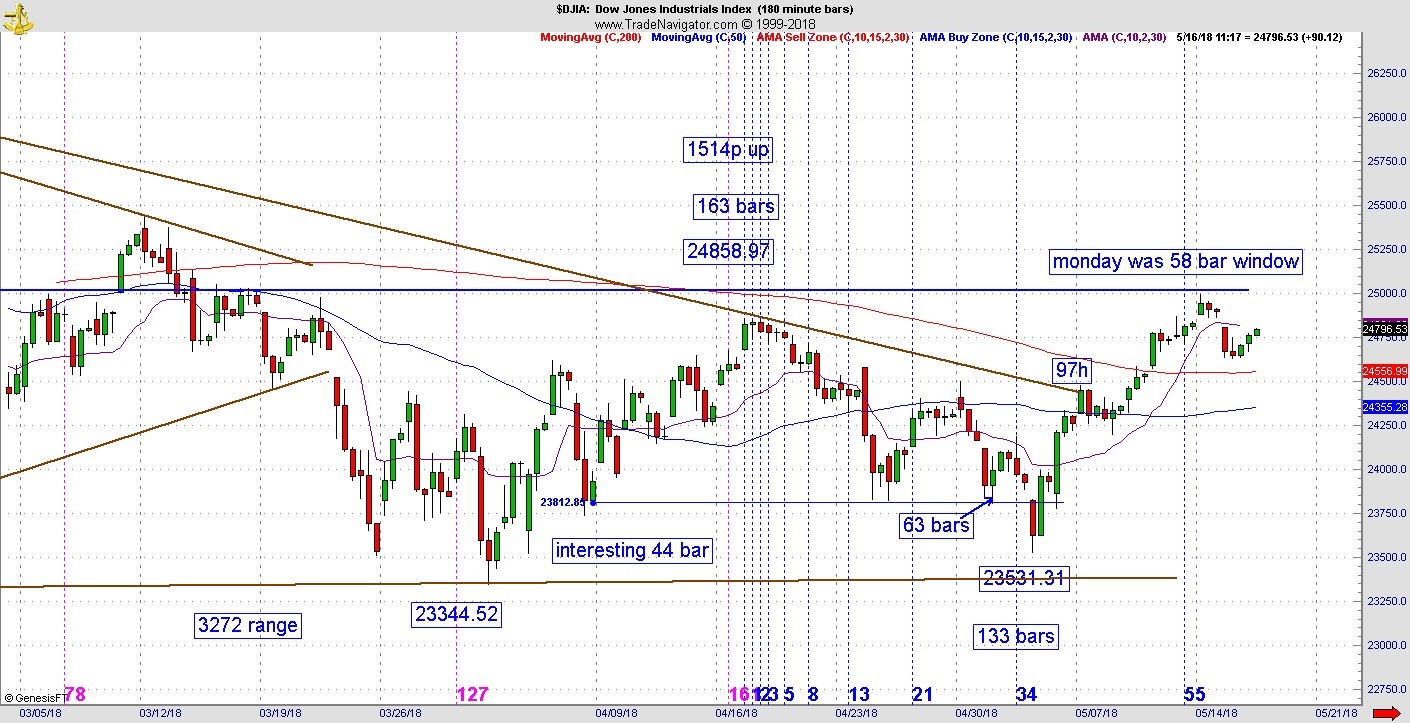
Right now, we have a very interesting test working in the Dow. Long-time readers of this column know I’ve been following a major vibrational balance line since late February. It’s a test I’ve been waiting on ever since the Dow hit that 23344 bottom in 44 days.
It only took roughly 43 calendar days to get this test. Yes, Monday’s high is really 43 calendar days off the bottom, so Tuesday’s gap down makes 44.
As you can see on the chart the prior high was 24858 and when we scale down to the 180 min chart, we see Monday was 57-58 bars (58 vibration) off that April 17 pivot.
What we have here is the ultimate retest of our balance line which includes a fresh square out off the prior pivot. Consequently, we got the initial reaction, but bulls are not giving up and retesting the line here since markets did not follow through on Tuesday’s bearish bar.
The hypothesis from here is the result of the test of this inflection point is going to lead to the next important move.
Briefly, if you read between the lines markets are not that far from the perfect storm. On Tuesday the bond market made fresh lows for this bear phase.
Recently the long bond failed its balance line which was holding the price action up. It should concern everyone interest rates keep inching higher. Each time there is a violation where prices break lower, it means rates go higher. For an economy that is supposedly doing better, the markets fear rates and not absorbing them very well. Likewise, oil is still threatening to go higher.
Every time oil prices break to the upside the benefit of the tax cuts which puts a few more dollars in the American worker’s wallet evaporates a little more.
With oil and bonds going the wrong way, it could be the perfect storm developing for a bigger bearish phase later in the year. If the Dow can’t break through what we’ve just discussed, that event could materialize sooner as opposed to later.
Jeff Greenblatt is editor at Lucas Wave International.


